June 24, 2013 feature
The CORE of the matter: Identifying recurrent genomic regions to determine tumor phylogeny

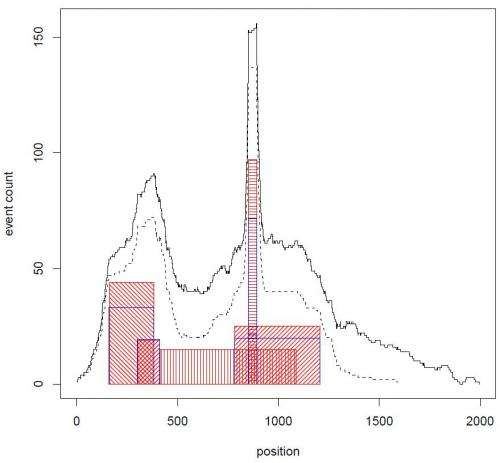
(Medical Xpress)—Analyzing genome-wide data from organisms, tissues or cells generates lists of genomic intervals – continuous structures on a genomic sequence, such as a chromosome. An interval's meaning is dependent on its genomic context, and can identify a region of cancer-related DNA copy number variations (alterations of a genome's DNA that results in the cell having an abnormal number of copies of one or more sections of that DNA). Recently, scientists at Cold Spring Harbor Laboratory devised the computational biology method CORE (Cores Of Recurrent Events) that explains genome-wide data in terms of a small number of cores – that is, recurrent intervals – for studying tumor subpopulations and cancer type copy number aberrations.
Prof. Alexander Krasnitz discusses the research that he, Prof. Michael Wigler, graduate student Guoli Sun, and Dr. Peter Andrews conducted. "The main challenge in constructing our method was to find a suitable form of what we call explanation," Krasnitz tells Medical Xpress. The researchers' method utilizes a core to "explain" an observed interval event by assigning a measure of geometric association between the two. "Some of the forms we proposed and used identify recurrence of both broad and narrow genomic regions," Krasnitz adds, "allowing the method to work across a wide range of sizes of genomic regions, from less than a single gene to entire chromosomes."
Krasnitz notes that CORE was implemented as a combinatorial optimization procedure that includes statistical tests that had to be designed with great care. "In any study," he points out, "statistics is often the most treacherous part. Err in one direction, and you will miss important findings – but err in the opposite direction, and you will make false, irreproducible discoveries. It took us great effort to find the middle ground."
The first step in demonstrating CORE's ability to explain data with cores of widely varying lengths was to examine system performance with synthetic data. "Generating artificial data where the answers that the algorithm is supposed to provide are known in advance is standard practice in the field of data analysis," Krasnitz comments. "CORE passed this test to our satisfaction." The researchers then provided two demonstrations of CORE's utility with actual data. "By this we mean that on the one hand, CORE uncovers the genealogy of cells in a tumor, and on the other, can identify characteristic patterns of copy number variation in breast cancer."

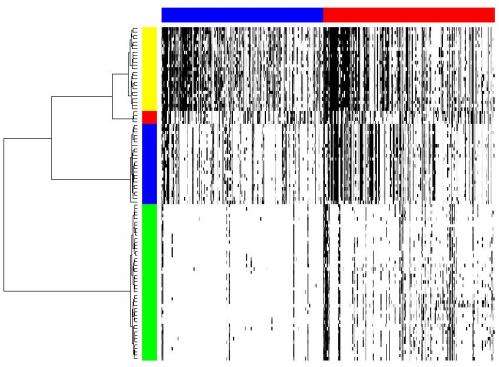
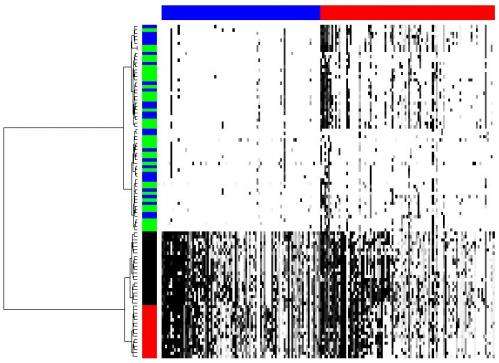
One of the ways the scientists applied their methodology was to determine tumor cell population phylogeny (that is, the history of cellular lineages as they change through time). To accomplish this, they applied CORE to a collection of DNA copy number profiles from single cells of a tumor. "These single-cell genomic profiles are now available thanks to highly innovative experimental work of Michael Wigler and his team," Krasnitz points out.
"Moreover," Krasnitz continues, "it's crucially important to determine how cells found in a tumor are related to each other genealogically." For example, he illustrates, they sometimes find that cells closely related to each other reside far apart in the tumor mass, which points to their ability to migrate rather than stay anchored as a healthy epithelial cell would. "However," he cautions, "our reconstructed genealogy must be accurate if we were to make such a claim."
Features that separate subpopulations are found among the cores. Indentifying such features also presented a statistical challenge. "What exactly do we mean," Krasnitz illustrates, "when we say that feature A is present in the genome of a cell? After all, cores are extended objects, not individual letters of the genome. What if a genomic region found in a cell is similar to the core but not quite identical to it? Can I still claim that the core is present in the genome of the cell? There are many different answers, depending on the degree of similarity required.' As a result, the researchers had to test many hypotheses, as is often the case when analyzing complex data. To alleviate the problem, he adds, they borrowed techniques from machine learning.
Another key difficulty was applying CORE to comparative genomic hybridization data from a large set of tumor samples in order to define regions of recurrent copy number aberration in breast cancer. "For each tumor analyzed," Krasnitz relates, "we had to deal with genomic data averaged over millions of tumor cells. This averaging weakens our ability to detect DNA copy number changes present in some, but not all, the cells. We had to overcome this difficulty before we could apply CORE."

In this case, Krasnitz explains, they were able to detect very narrow cores alongside cores that span entire chromosome arms. Moreover, some of the narrow cores point to known important breast cancer genes, such as ERBB2, a Herceptin® (trastuzumab) target. "This suggests that other narrow cores should be explored for presence of potential drug targets," notes Krasnitz.
Despite the array of significant challenges, Krasnitz sees one key innovative concept of the paper being of overriding value: explanation. "As one of our reviewers pointed out," he says, "maximizing explanation is an alternative to maximizing likelihood as an approach to modeling experimental data. We hope that this notion can take root in other areas, not only in genomics."
For example, Krasnitz points out that in network analysis, these ideas can be used to find an optimal set of hubs such that each node in the network is connected to at least one hub. Another example of a problem where CORE may be useful, he adds, is how to hire a fixed number of experts from a large pool of candidates so as to maximize their collective knowledge.
An interesting aspect of this research is that certain association measures are more favorable than others with regard to algorithmic complexity. "This is a good illustration of how interconnected modern science is," observes Krasnitz. "In the early stages of the work we were interested in one particular form of explanation. We first tried to solve the problem by brute force – that is, by exhaustively searching for the best among an enormous number of possible solutions – but soon ran out of computing power. We were surprised to find out that an analogous problem was very elegantly solved back in 1991 by two Israeli mathematicians working in the area of operations research, Refael Hassin and Arie Tamir, who demonstrated that in this particular case the complexity of the problem could be considerably reduced1. Unfortunately – as we later understood – this form of explanation, while advantageous computationally, is not ideal for problems in genomics."
Moving forward, the scientists are exploring other forms of explanation that are better able to take into account randomness present in genomic data. "First, we're planning to release CORE as public software to enable its use by other researchers," notes Krasnitz. "Internally, we have two ongoing studies – one using cores as markers for response to drug therapy in cancer, and another using CORE to improve molecular diagnostics of cancer patients."
More information: Target inference from collections of genomic intervals, PNAS June 18, 2013 vol. 110 no. 25 E2271-E2278, doi:10.1073/pnas.1306909110
Related
1Improved complexity bounds for location problems on the real line, Operations Research Letters 10 (1991), 395-402, doi:10.1016/0167-6377(91)90041-M (PDF)
© 2013 Medical Xpress. All rights reserved.


