New insights for personalized cancer treatment

Doctors increasingly work with large quantities of digitized patient data – and yet the insights it contains often remain unexploited. Fraunhofer researchers have developed a software program that allows doctors to extract information from multiple patient files to quickly obtain new pointers for the treatment of prostate cancer.
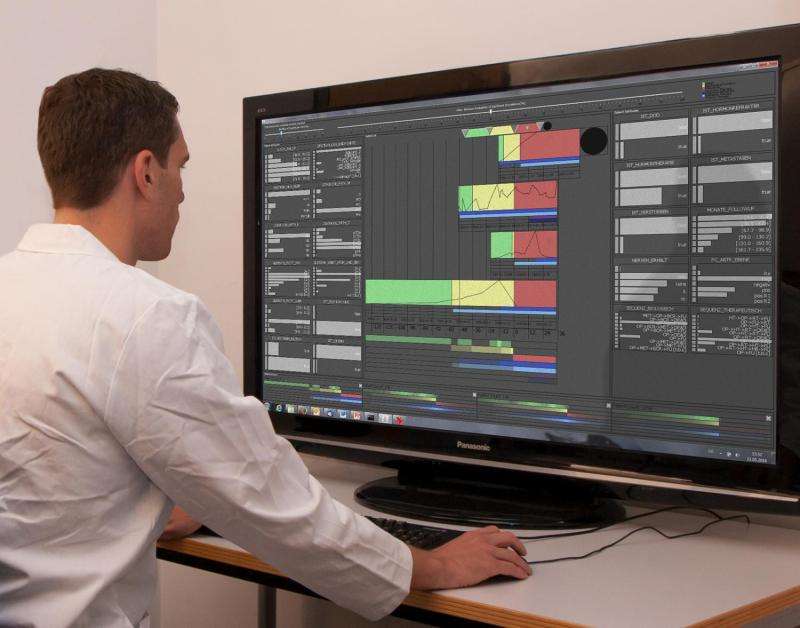
While each patient history is unique, there are also commonalities among cases. Of particular interest to doctors is how different patients react to a specific treatment. They group similar cases into cohorts they use to draw conclusions for future treatment. The Fraunhofer Institute for Computer Graphics Research IGD in Darmstadt has developed software that allows doctors to quickly find the similarities in digitized patient files and display them in a user-friendly format. The clever thing about the program is that it uses a smart algorithm to adapt to the user's particular interest. "The algorithm processes complex data sets and visualizes that which is of interest to the user. We call this visual analytics," explains Prof. Jörn Kohlhammer, head of the Information Visualization and Visual Analytics department at Fraunhofer IGD. Doctors benefit because they can quickly group patients into cohorts and speed up the process of gaining fresh insight from the large quantities of patient data. Prostate cancer is a good example: to analyze a treatment's effectiveness, it is important to know in which cases the cancer progressed in a similar way and the medicines used to treat the patients.
Explaining through visualization
Visualization can help people understand large quantities of data, as software transforms meaningless columns of numbers into conclusive graphics. Instead of struggling through each individual patient file, the user sees pictures on a screen. On top of that, doctors need just a few clicks to go from the data overview into an individual patient's digital file, where they can quickly compare blood values, age or treatment plans.
Visualizing diabetes, ENT ailments and allergies
"Our research strives to divide work between humans and machines in a way that suits their strengths: the machine to rapidly process and display data, the human to draw the correct conclusions from the data," says Prof. Kohlhammer. "Cohorts play an important role in treating other illnesses as well, and we are confident that we will soon be able to apply our method to diabetes, allergies, and ear, nose and throat ailments."


