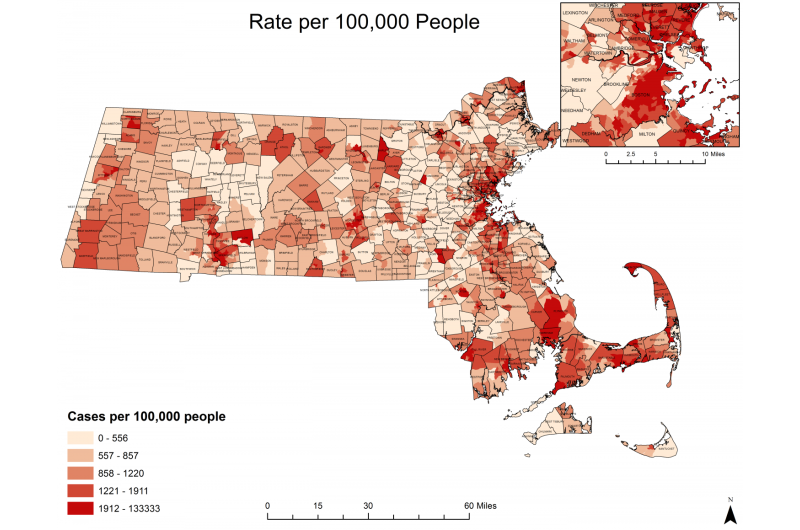
HCV rates per 100,000 in Massachusetts census tracts, 2002-2013 are shown. Credit: Thomas J. Stopka, T.J., Goulart, M.A., Meyers, D.J., Hutcheson, M., Barton, K., Onofrey, S., Church, D., Donahue, A., and Chui, K.K.H. Identifying and characterizing hepatitis C virus hotspots in Massachusetts: a spatial epidemiological approach. BMC Infectious Diseases. Published online April 20, 107. DOI: 10.1186/s12879-017-2400-2
An innovative analysis combining geographic information systems (GIS), spatial epidemiology, and statistical modeling identified three hotspot clusters of hepatitis C infection rates in Massachusetts. The study, published in BMC Infectious Disease, found that areas around Boston, New Bedford, and Springfield had the most significant clusters of hepatitis C infection based on rates per 100,000 people.
Hepatitis C (HCV) hotspot clusters based on the number of reported cases were also identified. As expected, these included some of the most populated areas in Massachusetts: the Greater Boston area, Worcester, Springfield, Lowell, New Bedford, Fall River, but also in the smaller cities of Lawrence, Holyoke and Fitchburg. In these areas, results of density analyses indicate that there were between 477 to 1,070 hepatitis C cases per square mile.
"We are in the middle of a syndemic," said public health epidemiologist Tom Stopka, Ph.D., M.H.S., lead study author. "The opioid epidemic is intertwined with the hepatitis C epidemic. These two operate symbiotically and create a larger burden on society and our healthcare system. The areas with higher rates of infection can also become areas of risk for higher hepatitis C transmission. Our study identifies and characterizes locations in Massachusetts where prevention and treatment interventions for hepatitis C might have the biggest effect in reducing the burden of disease."
"The use of spatial epidemiological approaches to identify and characterize HCV clusters can help identify where to make best use of the limited funding available for education, prevention, testing, and treatment in order to have the greatest impact and return on that investment," he continued.
Stopka is an assistant professor of public health and community medicine at Tufts University School of Medicine. He focuses on spatial epidemiology, infectious disease, and health disparities, particularly with respect to substance use and misuse.
By combining more than 84,000 cases of individuals with past or present hepatitis C infection reported to the Massachusetts Department of Public Health between 2002 to 2013 with sociodemographic data from 1,464 Massachusetts census tracts, and then conducting statistical analyses, the research team was able to determine which areas in Massachusetts had both the highest number of cases (counts) and the highest rates (taking into account population density), and characterize factors associated with HIV hotspots. The count and rate information was used to calculate and visualize geographic clusters, resulting in maps that reflected hotspots of infection.
The use of GIS and spatial epidemiological analysis of public health surveillance data, which allow policy makers to better understand the geographic distribution of infectious diseases and factors associated with disease clustering, has been limited, particularly for hepatitis C.
An estimated 3.2 million Americans have hepatitis C, which can result in severe long-term health problems and sometimes death. It is associated with injection drug use, can be transmitted by blood-to-blood contact with contaminated syringes, and can take decades to appear, and the cost of treatment is in the tens of thousands dollars per patient.
Public health officials are concerned about long-standing and initially-silent hepatitis C infections in baby boomers, but infections are rising fastest among young adults in the United States, mirroring trends seen in heroin injection, opioid-related overdoses, and infectious endocarditis. In Massachusetts, there was a 137 percent increase in hepatitis C cases among 15 to 29 year olds between 2002 and 2013. However, little was known about the geographic clustering patterns of hepatitis C infections, which limited efforts to better understand disease transmission and develop targeted responses.
Stopka notes that the data analyzed in the study captured where an individual resided when hepatitis C was reported, and not when it was transmitted. Because of this, hotspots can include reported cases where hepatitis C infections originated years earlier and in different locations, and may not fully reflect current infection patterns. Nevertheless, the current reporting systems offer the best available option to better understand the geospatial distribution of HCV.
The geospatial approach used in the study may also provide insights for other disease risks, in particular HIV infections, which previous studies have shown tend to overlap with hepatitis C hotspots. The current HCV epidemic may forecast future HIV and HCV co-infection outbreaks. Combined geospatial and statistical analyses can help identify regions of risk, improve understanding of transmission patterns, reveal demographic and socioeconomic associations, and inform public health policy decisions, write the authors.
More information: Thomas J. Stopka et al, Identifying and characterizing hepatitis C virus hotspots in Massachusetts: a spatial epidemiological approach, BMC Infectious Diseases (2017). DOI: 10.1186/s12879-017-2400-2
Provided by Tufts University


