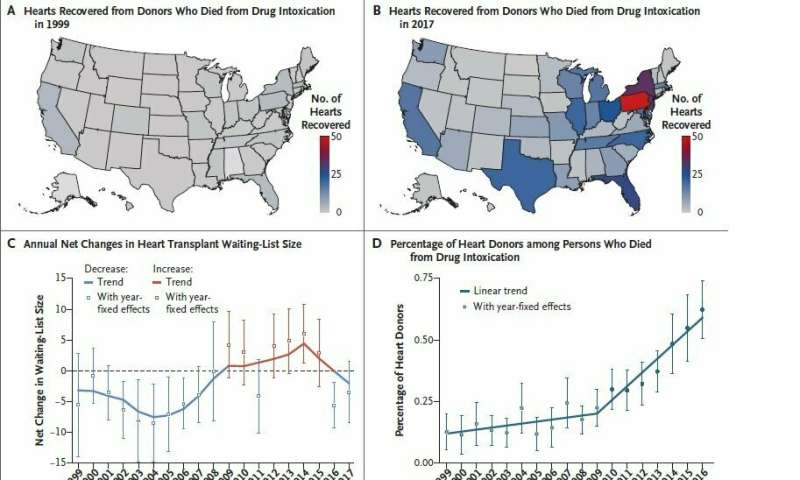
Figure 1. Temporal Changes among Heart Donors Who Died from Drug Intoxication, Heart Transplant Waiting-List Size, and Rate of Donor Heart Recovery. Panel A shows the geographic distribution of hearts recovered from donors who died from drug intoxication in 1999, and Panel B showsthe geographic distribution in 2017. Map graphics were created with the use of Microsoft Excel with software powered by Bing (DSAT forMSFT, GeoNames, and Navteq). Panel C depicts the predicted annual net changes in the size of the heart transplant waiting list from1999 to 2017, calculated by subtracting the total number of registrations that were removed from the number of new registrations. Predictionswere based on ordinary least squares estimates of their mean, taking into account the time trends (the conditional mean); thesenationwide time trends were estimated with the use of state-level data (Organ Procurement and Transplantation Network, 1999-2017).The conditional mean was also estimated with the use of yearly dummy variables to isolate a fully flexible time-specific component,yielding the year-specific predicted values plotted on the vertical axis. Years with net decreases in the waiting-list size are presented inblue, and years with net increases in red. I bars indicate 95% confidence intervals. Panel D shows the percentage of heart donors amongthe total number of persons who died from drug intoxication in United States from 1999 through 2016; nationwide time trends were estimatedwith the use of state-level data. A spline function was used to model the linear trend in this percentage, capturing the differencein trends before and after 2009. The conditional mean was also estimated with the use of yearly dummy variables to isolate a fully flexibletime-specific component, yielding the year-specific predicted values plotted on the vertical axis. Shaded circles represent significantdifferences in these coefficients from the baseline year (1999), as determined with the use of White-Huber robust standard errors at the1% significance level. I bars indicate 95% confidence intervals. Credit: Brigham and Women's Hospital/New England Journal of Medicine
Drug intoxication deaths have risen dramatically over the past several decades. From 1999 to 2016, the number of deaths due to drug intoxication more than tripled. Over the same period, the number of hearts recovered for heart transplantation has dramatically increased, with the proportion of hearts from drug-intoxication-related donors now making up 17.6 percent of available organs.
Transplantation and cardiology experts at Brigham and Women's Hospital, in collaboration with colleagues at the London School of Economics, analyzed these patterns as well as state-wide variations in the number of donor organs recovered from drug-intoxication-related deaths. They found substantial variability from state to state and region to region. Their findings are detailed in The New England Journal of Medicine.
"In the U.S., the drug crisis is clearly not uniform, and neither is the rate of recovered hearts from drug-intoxication-related deaths," said corresponding author Mandeep Mehra, MD, the medical director of the Brigham's Heart and Vascular Center. "The fact that there's heterogeneity between regions means there's ample opportunity to learn from each other."
The team analyzed data from the Organ Procurement and Transplantation Network to determine changes in the size of the transplant waitlist and data on drug-intoxication deaths from the Centers for Disease Control and Prevention WONDER online database. Bringing these datasets together allowed the team to calculate the proportion of recovered donor hearts from drug-intoxication-related deaths.
The team reported major increases in drug-intoxication-related deaths and organ recovery in the Northeast, Midwest and Southwest. Overall, the team estimated that 6.24 hearts are recovered from every 1,000 lives lost due to drug intoxication.
"Since one donor may provide a variety of organs to multiple recipients, the total number of people on waitlists who can receive a life prolonging transplant may be substantially higher," said Mehra.
While the number of people added to the waitlist for heart transplants increased each year, the number of available organs has also substantially increased. The waitlist size began to shrink in 2016 and 2017.
"This is a very important outcome indicating that people are now adopting organs from drug-intoxication-related deaths as a viable source for lifesaving donor organs," said Mehra. "Although we support organ donation recovery from this source, those of us in the transplant community also strongly support effective efforts to combat the drug overdose crisis. We must pursue ways to target the crisis while simultaneously looking for new ways to increase the availability of viable donor organs."
More information: Vaduganathan, M et al. "Organ Donation and Drug Intoxication-Related Deaths in the United States" The New England Journal of Medicine, DOI: 10.1056/NEJMc1810758
Journal information: New England Journal of Medicine
Provided by Brigham and Women's Hospital


