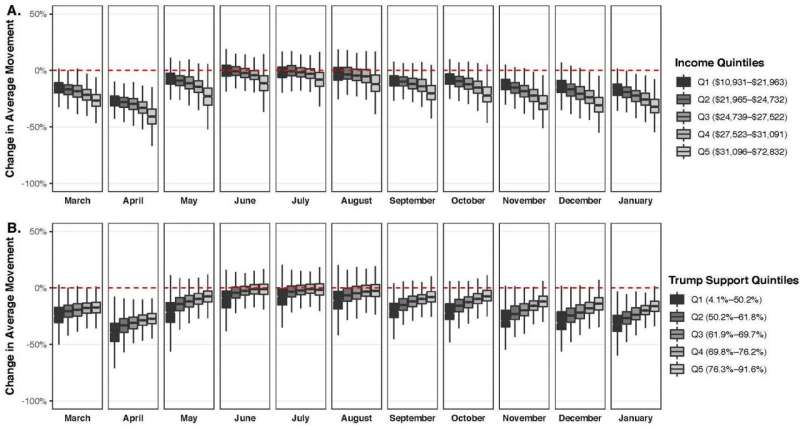
County-level distance traveled has been averaged by month and normalized to pre-COVID-19 levels. Negative values represent greater physical distancing. Dates range from March 9, 2020 to January 17, 2021. Based on physical distancing data from 15-17 million anonymized cell phone users per day in 3,037 US counties from Unacast. County-level characteristics were obtained from the American Community Survey and MIT Election Data and Science Lab. Credit: American Journal of Preventive Medicine
Using nearly a year of anonymous geolocation data from 15-17 million cell phone users in 3,037 United States counties, investigators have found that individuals with lower income per capita or greater Republican orientation were associated with significantly reduced social distancing throughout the study period from March 2020 through January 2021. Their findings are reported in the American Journal of Preventive Medicine.
The associations persisted after adjusting for a variety of county-level demographic and socioeconomic characteristics. Other county-level characteristics, such as the share of Black and Hispanic residents, were also associated with reduced distancing at various points during the study period.
"We started this project in April 2020 because we wanted to understand the social, economic, and political factors that drive people to engage in social distancing. We ended up tracking these factors for almost a year," explained lead investigator Nolan M. Kavanagh, MPH, Perelman School of Medicine, University of Pennsylvania, Philadelphia, PA, USA.
"A year is a long time to prepare policy responses and educate the public," he said. "Yet, the same kinds of communities that struggled to physically distance early on continue to struggle now."
To measure social distancing, the investigators used county-level averages of distance traveled per person using cell phone location data. They looked at the percentage change in average movement from the start of the pandemic relative to four pre-COVID-19 reference weeks. Statistical analysis was used to estimate the association between a variety of county-level demographic, socioeconomic, and political characteristics. Socioeconomic status was based on income per capita, and political orientation was based on the 2016 vote share for President Trump. Other county-level characteristics examined included the percentage of males, Black and Hispanic residents; share of residents over age 65; share of foreign-born residents; share of the workforce in industries most affected by COVID-19, such as retail, transportation and health, educational and social services; and the share of rural residential plots. These county-level characteristics were chosen based on their expected contribution to a community's ability to physically distance.
Investigators found a sharp reduction in average movement among US counties at the start of the COVID-19 pandemic and declaration of a national emergency in March 2020. Social distancing was greatest from late March to early June and then returned to baseline levels by June 2020. Distancing began to increase again in early September. However, even as a national trend evolved, the investigators found substantial variability in social distancing across counties.
While the share of racial and ethnic minorities, immigration, rurality, and employment in transportation were correlated with changes in average movement on many days, the single most consistent predictor of engagement in distancing across the study was higher per capita income. The single most consistent predictor of lack of engagement with distancing across the study was share of vote for President Trump.
Other county level-characteristics varied over time in their degree of association with physical distancing. During the early months of the study, counties with greater shares of Black and Hispanic residents were less likely to engage in social distancing. These adjusted racial and ethnic differences closed during the summer months before re-emerging in the fall. Similarly, rural counties were less likely to engage in distancing early on; by the end of the summer, rurality became the strongest negative predictor of physical distancing.
The investigators suggest a number of barriers that may underlie these findings. For example, lower-income or gig jobs may be incompatible with working from home, and lower income households may not have the necessary liquidity to shop in bulk, requiring more trips for groceries and essential household items. They observe that partisanship has dramatically shaped the government and public response to COVID-19 in the US. These findings show that political differences have continued to shape social distancing behavior, months into the pandemic and extending beyond the 2020 general election. As a result, both low-income and Republican-leaning communities are at greater risk for COVID-19.
"These results suggest that policy responses to the pandemic have failed to level the playing field," said Mr. Kavanagh. "We have not addressed the challenges to physical distancing faced by low-income Americans, such as working from home. And messages by political and public health leaders have not reached populations who may have different beliefs about disease risk. Analyses such as this study that monitor disparities over time can help us target public health and economic interventions to the communities that need them the most."
More information: Nolan M. Kavanagh et al, County-Level Socioeconomic and Political Predictors of Distancing for COVID-19, American Journal of Preventive Medicine (2021). DOI: 10.1016/j.amepre.2021.01.040
Journal information: American Journal of Preventive Medicine
Provided by Elsevier


