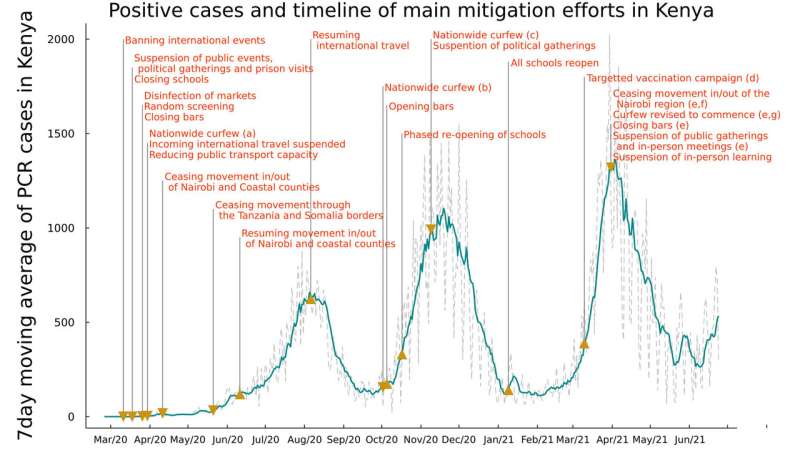
Fig. 1. 7-day moving average of daily positive PCR tests from the Kenyan national linelist and a timeline of the main mitigation events applied by the Kenyan government representing tightening (down-arrow) and relaxation (up-arrow) of measures. (a) curfew from 7pm to 5am; (b) curfew from 11pm to 4am; (c) curfew from 10pm to 4am; (d) front line workers and individuals older than 58 years (approximately 1.2m doses); (e) the region includes Nairobi, Kajiado, Machakos, Kiambu, Nakuru; (f) this restricted movement into and out of the block of counties in (e) but not between these counties; (g) curfew from 8pm to 4am. Credit: DOI: 10.1126/science.abk0414
Combining data on antibody prevalence, PCR test results, genomic surveillance and population mobility from smartphones has allowed infectious disease modelers to explain the evolution of the first three COVID-19 waves that have affected Kenya since the start of the pandemic.
Modeling jointly undertaken by the University of Warwick and KEMRI-Wellcome Trust Research Programme in Kenya explains the COVID-19 pandemic in Kenya as sequential waves of transmission through different socio-economic groups, followed by infection boosted by the introduction of new variants.
The study has been published in the journal Science and received funding through the Joint Initiative on Research in Epidemic Preparedness and Response, a collaboration between Wellcome and the Foreign, Commonwealth and Development Office (FCDO), as well as funding from the National Institute for Health Research (NIHR).
Forecasting the future spread of COVID-19 requires an understanding of past patterns. The team used a mathematical model to test explanations for the first three COVID-19 epidemic waves in Kenya.
The work, undertaken jointly by scientists at the University of Warwick and the KEMRI-Wellcome Trust Research Programme in Kenya, for the first time brought together COVID-19 antibody survey data, PCR case data, genomic variant data and Google mobility data, seeking to find an explanation to the waves of COVID-19 in Kenya. The aim was to then provide policy-based forecasts on future waves in the country based on the model findings.
Lower socio-economic groups have been identified as vulnerable to SARS-CoV-2 in the global South due to residence in informal settlements at high population density, reduced access to sanitation, and dependence on informal employment that requires daily mobility. In contrast, those from higher socio-economic groups with job security can work from home, physically distance and readily access water and sanitation, thereby decreasing transmission.
The results from the modeling show that the first and second waves of infections are explained by differences in mobility and contact rates between high and low socio-economic groups within Kenya. In the initial phase of the epidemic (from March 2020), individuals in high socio-economic groups were able to reduce their mobility and contact rates, but individuals in lower socio-economic groups were not. This resulted in transmission among individuals in lower socio-economic groups that was observed as the first wave in urban centers. As these individuals recovered from infection and became immune, at least temporarily, the first wave ended.
By the time of the second wave (from October 2020), individuals in high socio-economic groups had increased their contact rates and mobility. This led to transmission among individuals in the high socio-economic groups that was observed as the second wave, and in addition the second wave involved rural as well as urban areas. It appears that the second wave then ended as individuals cleared the virus and became, at least temporarily, immune. However, the new Beta and Alpha variants introduced into Kenya were more infectious and led to a third wave among both high and low socio-economic groups (from March 2021).
Multiple waves have been observed in many other African countries that do not appear to be completely explained by the timing of restrictions, and since they also have in common similar socio-economic groupings in urban centers, the scientists speculate that these explanations may apply more widely. Understanding the causation of such multiple waves is critical for forecasting hospitalization demand and the likely effectiveness of interventions including vaccination strategy.
Dr. Samuel Brand from the University of Warwick's Zeeman Institute for Systems Biology and Infectious Disease Epidemiological Research (SBIDER), and School of Life Sciences said: "This is one of the first studies to consider detailed predictions of the dynamics of COVID-19 across multiple waves in tropical sub-Saharan Africa. We believe this sets a new standard for the type of public health modeling work that can be conducted in real-time in developing countries."
Dr. John Ojal of KEMRI-Wellcome Trust Research Programme said: "There are highly detailed modeling studies of this nature in High Income Countries, but there have been none previously in tropical sub-Saharan Africa."
Professor Matt Keeling, Director of the Zeeman Institute at the University of Warwick, said: "Studies in High Income Countries find the assumption of even mixing of the population works well in explaining the transmission of SARS-CoV-2 in those countries. Clearly, this is not always the case as shown in our study of Kenya, and variation in spread by socio-economic group might prevail in other low income settings."
Professor Edwine Barasa, director of the Nairobi hub, KEMRI-Wellcome Trust Research Programme said: "I am not surprised by the findings of marked disparity of transmission by socio-economic group in Kenya where there is a very high proportion of the urban population working in the informal sector that do not have the luxury of reducing contacts but need to find work on a day-to-day basis."
More information: Samuel P. C. Brand et al, COVID-19 Transmission Dynamics Underlying Epidemic Waves in Kenya, Science (2021). DOI: 10.1126/science.abk0414
Journal information: Science
Provided by University of Warwick


