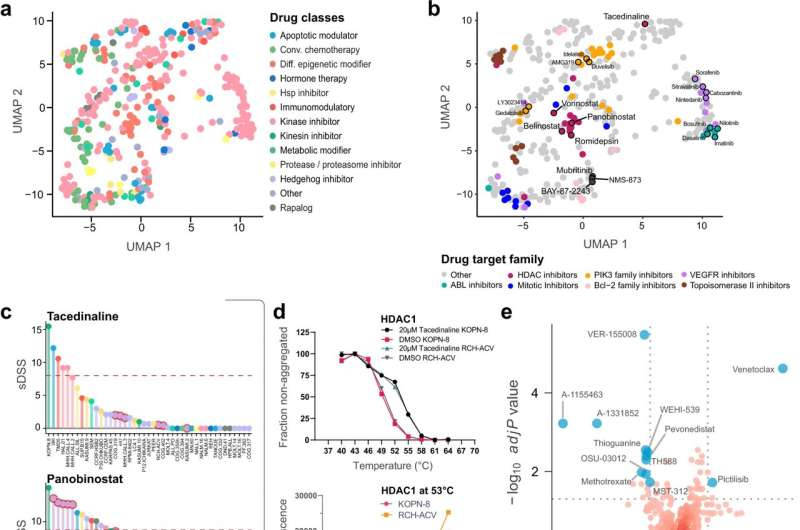
Pharmacoproteomics identifies drug mechanisms of action in childhood ALL cell lines. a UMAP of the distribution of class-annotated drugs as a two-dimensional reduction. Drugs were correlated to gene symbol-based protein quantification data based on sDSS, and Pearson correlation scores from this analysis were used to generate the UMAP. Each drug is annotated by its class. b UMAP dimensional reduction of each drug, calculated using Pearson correlations between sDSS and protein abundance. Each drug is annotated by a specific target family. c sDSS of the tacedinaline (top panel) and panobinostat (bottom panel) across the tested cell lines. The tacedinaline resistant TCF3-PBX1 fusion cell lines are highlighted with red circles. The red dashed line indicates the selected threshold of sDSS = 8. d CETSA derived Tagg (aggregation temperature) curves for HDAC1 in KOPN-8 and RCH-ACV cells in the presence of DMSO and 20 μM tacedinaline after 3 h incubation. All data were normalized to the response observed for each treatment condition at the lowest test temperature (top panel). Dose-response CETSA of tacedinaline incubated for 3 h at seven different concentrations ranging from 100 μM to 24 nM at 53 °C based on raw chemiluminescence data from the western blot analysis for HDAC1 in KOPN-8 and RCH-ACV cell lines (bottom panel). Data were provided as two individual data points from two independent experiments (n = 2) for each cell line. e Volcano plots of differential drug sensitivity between B-lineage and T-lineage ALL cell lines. The cut-off was set at adjusted t-test P value q ≤ 0.02 and the delta mean sDSS between the B-lineage and T-lineage cell lines set at ≥5. Selected drugs are annotated as blue circles. f The correlation between the sDSS for venetoclax in the DSRT and relative protein level of BCL2 (top panel) and sDSS for A-1155463 and relative protein level of BCL2L1 (bottom panel) for the 43 tested ALL cell lines. The x-axis shows the relative log2 protein level of the protein and the y-axis shows the sDSS for each respective cell line (n = 43). The Pearson correlation coefficient (R) and two-sided t-distribution P values (P) for the comparison are shown in each plot. The linear regression trendline (black) and its 95% confidence interval (shaded gray area) are shown in the graph. The colors indicate the cytogenetic subtype of the cell lines. g Ranked OSU-03012 sDSS and protein Pearson correlations, highlighting members of the TCP1 containing chaperonin complex, HSP90AB1, and PDPK1 interacting proteins from the STRING network database. h Scatter plot of OSU-03012 sDSS and relative log2 protein level of HSP90AB1 and TCP1 for each of the BCP-ALL cell lines (n = 25). The x-axis shows the relative log2 protein level of the protein and the y-axis shows the sDSS for each respective cell line (n = 25). The Pearson correlation coefficient (R) and two-sided t-distribution P values (P) for the comparison are shown in each plot. The linear regression trendline (black) and its 95% confidence interval (shaded gray area) are shown in the graph. Points are labeled by cytogenetic subtype of each represented BCP-ALL cell line. Credit: Nature Communications (2022). DOI: 10.1038/s41467-022-29224-5
Researchers at the Department of Oncology-Pathology have published a paper in Nature Communications where they created a cell line resource dataset and analysis tool that could be used to identify the traits that make specific leukemias sensitive to new types of targeted therapies.
The researchers used cell lines from childhood acute lymphoblastic leukemia (ALL) patients with different forms of the disease and analyzed proteins, RNAs, and sensitivity to 528 drugs clinically approved or under investigation. Comparing cell lines that responded to drugs in different ways could identify drug mechanisms and the traits that make leukemias sensitive or resistant to those therapies. For some drugs, the researchers identified that they might work through secondary off-target mechanisms. In a higher-risk ALL subtype, which responds poorly to standard chemotherapy, they identified unexpected sensitivity to a type of immunotherapy drug, which increases the strength of the molecular signals that activate immune cells.
ALL is the most common childhood cancer. Most patients can be treated with chemotherapy and stem cell transplantation, but 15–20% will respond poorly, and this patient group lacks treatment options and has high mortality risk. Additionally, current standard treatments can have a long-term health burden for children who survive their cancer. There is a need to identify therapeutics which are less severe than standard treatments and which could help patients that don't respond to current options. The researchers' results provide a foundation for exploring biological differences and new targeted therapies in childhood ALL, and serve as a broad public resource that will support other research projects.
The researchers used a panel of 49 childhood ALL cell lines and acquired mass-spectrometry based in-depth proteome measurements, RNA sequencing, high-throughput drug screening, and fusion gene analysis. They created a web-based platform which allows the public to explore and analyze the dataset. They performed analyses that integrated these data types and improved understanding of biological differences. They performed analyses to profile the mechanisms of effective drugs in the screen. They performed validation experiments to understand drug mechanisms in depth.
"We will further validate the results in the dataset with the highest potential for future clinical benefit," says Rozbeh Jafari, senior researcher at the Department of Oncology-Pathology and last author of the paper. "We hope to expand the represented subtypes of childhood leukemia in the dataset, and to explore further characterizations of our drug sensitivity and biological mechanism results in clinical samples and other models. We are also interested in developing new methods to understand drug activity and to analyze and interpret similar comprehensive datasets measuring multiple molecular parameters."
More information: Isabelle Rose Leo et al, Integrative multi-omics and drug response profiling of childhood acute lymphoblastic leukemia cell lines, Nature Communications (2022). DOI: 10.1038/s41467-022-29224-5
Journal information: Nature Communications
Provided by Karolinska Institutet


