How brains form visual maps

Maps have played an important role in scientific progress. Claudius Ptolemaeus transformed our understanding of the world with his map of Earth, and Tycho Brahe enhanced understanding of the universe with his map of the stars. The maps of the human body from Claudius Galenus, Leonardo da Vinci and Andreas Vesalius paved the path toward modern medicine, and recent progress in human brain mapping is helping us understand better who we are.
Our brains have multiple maps that are needed to plan our movements, navigate our environments, and perceive the world through our senses. The brain maps of our visual world have been studied in greatest detail and provide an opportunity to understand how other brain maps form, organize and function. Intensive research over the past decades demonstrates that maps in the primary visual area of the cerebral cortex contain an intricate representation of multiple stimulus dimensions that include spatial location, eye input, light-dark polarity, orientation, and width. For example, a capital "I" in this page is mapped in the primary visual cortex as "location [x, y], both eyes, dark, vertical, and thin."
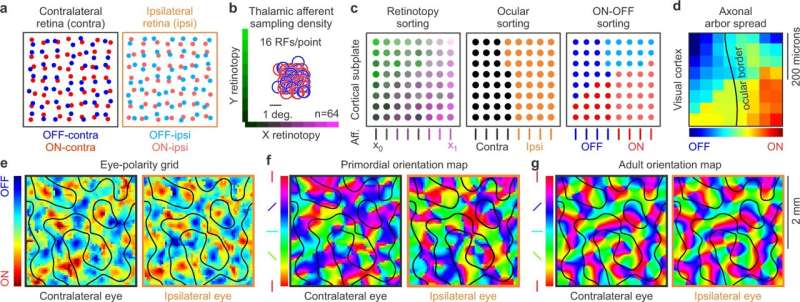
Mapping our visual world in a small piece of cortex can be challenging. Remarkably, species as different as primates, carnivores, and scandentia appear to follow a common strategy and all map stimulus orientation in a pinwheel pattern. In a new paper that will be published in Nature Communications, scientists propose a theory that explains the diversity of visual maps in nature and the origin of pinwheel patterns in orientation maps.
The theory proposes that map diversity emerges from variations in the sampling density of visual space. As sampling density increases during evolution, the cerebral cortex receives more neuronal inputs per visual point that are accommodated in larger cortical areas of larger brains. The larger cortical areas allow sorting the neuronal inputs in clusters that respond to the same stimulus properties: the same visual point, the same eye (left or right), and the same contrast polarity (light or dark). They also allow the inputs to combine into clusters of cortical neurons that maximize the diversity of stimuli extracted from each visual point. This maximization process creates a pinwheel pattern for stimulus orientation.
Scientists are still far from an accurate map of the human brain, but having a theory of brain map formation is an important first step toward reaching this milestone. The theory that the authors propose still needs to be confirmed, but it can already explain a large number of experimental observations. It also predicts a close topographic relation among all stimulus dimensions represented in a visual map, which greatly facilitates accurate reconstructions of the multi-dimensional maps needed for future cortical implants.
More information: Sohrab Najafian et al, A theory of cortical map formation in the visual brain, Nature Communications (2022). DOI: 10.1038/s41467-022-29433-y


