This article has been reviewed according to Science X's editorial process and policies. Editors have highlighted the following attributes while ensuring the content's credibility:
fact-checked
peer-reviewed publication
trusted source
proofread
Mapping the neural activity in mammalian brains

The function of the brain depends on the kind of circuit network it forms to enable perception and actions. No technology exists, however, to help reveal the structure of the hidden network by examining the neural activity in living animals.
Kyoto University and the Institute for Research in Fundamental Sciences (IPM) have now jointly created a map comparing this circuit structure with neural activity in mammals. The map enables researchers to gain a clearer picture of the circuitry from the characteristics of neural activity.
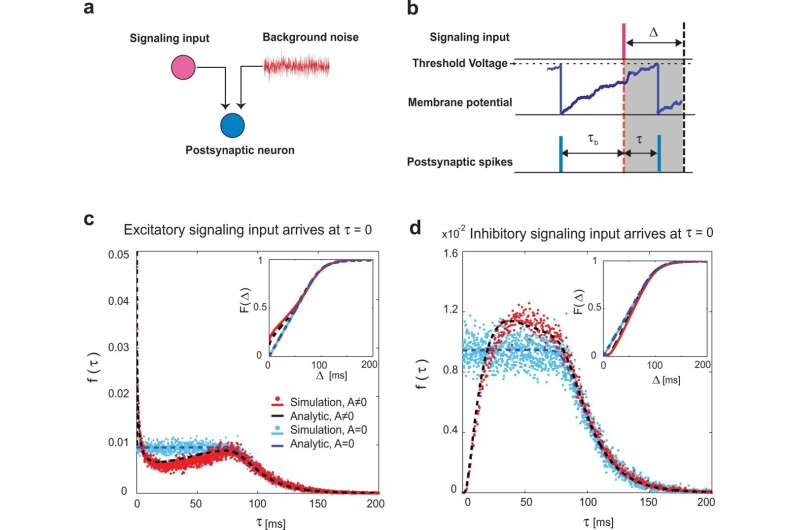
Nerve cells produce electrical signals called spikes that provide input potential to the next nerve cell through synapses. When the sum of the input potentials exceeds a certain value, a spike is generated transmitting its activity to the next nerve cell.
"The aim of this research was to construct a theory that integrates the structure and activity of neural networks and use it as a tool to discover the network structure from the activity," says Hideaki Shimazaki of the Graduate School of Informatics, Kyoto University.
Coupling between two nerve cells increases the possibility for one nerve cell to become active immediately after the other nerve cell becomes active. Efforts are being made to elucidate the network structure of neurons by estimating the connections between them from the co-activity of simultaneously recorded neurons. These, however, only showed a visible part of the greater picture that reveals the state of functional neural circuits responsible for driving animal cognition and behavior.
"To reveal the hidden connections from unobserved neurons, we used an analytic relation for nonlinearity between input and output of neurons. We showed it is possible to identify the hidden microcircuits architecture including unobserved neurons, from co-activities of observed neurons," says corresponding author Safura Rashid Shomali of School of Cognitive Sciences at IPM.
"We have learned that the similarity in behavior of people, or neurons, indicates their shared history. Here, behavior is the neuron's activity, and history is the hidden shared inputs they receive," says a co-author S. Nader Rasuli of Department of Physics at University of Guilan and IPM.
Applying this technique to the visual cortex of mammals, the researchers made new discoveries.
"Utilizing this map, we investigated the sparse activities of neurons in the visual cortex of mice and monkeys and showed that the excitatory local common input structure is behind the activities," explains Shomali.
The associated mechanism in the brain is called sparse coding, an energy-efficient scheme in the visual cortex that uses only a small number of neurons to express information. This mechanism counters the previously proposed hypothesis that the circuit network is dominated by inhibitory cells.
"The mechanism, which can be applied to AI, generates sparse activity and is expected to provide directions for constructing the connection structure of power-efficient deep neural networks and component neurons as non-linear elements," says Shimazaki.
The research is published in Communications Biology.
More information: Shomali, S.R. et al, Uncovering hidden network architecture from spiking activities using an exact statistical input-output relation of neurons. Communications Biology (2023). DOI: 10.1038/s42003-023-04511-z. www.nature.com/articles/s42003-023-04511-z


