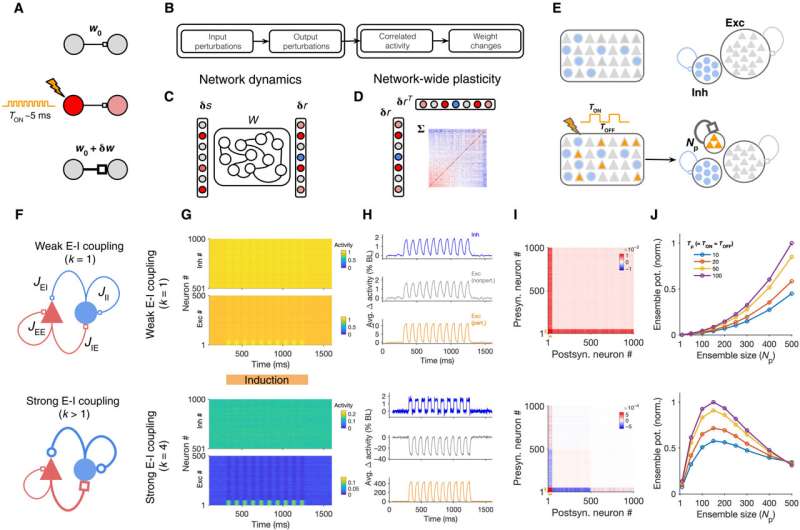
Induction of neuronal assemblies in different regimes of excitation-inhibition balance. (A) Schematic of conventional protocols for the induction and investigation of plasticity often involving a small number of neurons and perturbations with brief pulses. (B to D) Analytical steps (B) to evaluate the effect of external perturbations on the formation of assemblies involving dynamics of network responses (C) and network-wide plasticity (D). Knowing the weight matrix (W), input perturbations (δs) are transferred to output perturbations (δr) (C); the resulting correlated activity patterns of pre- and postsynaptic neurons (Σ), in turn, guide a network-wide plasticity of weights (D). (E) Schematic of the perturbation protocol to study plasticity in large-scale networks composed of excitatory (Exc) and inhibitory (Inh) neurons (top). Connections between subpopulations are not shown. Bottom left: Np excitatory neurons are perturbed with a series of stimulation pulses alternating between ON and OFF states. Bottom right: The result of perturbations in terms of the induction of assemblies is assayed by evaluating the potentiation of weights within the perturbed ensemble of neurons (orange) as a result of Hebbian learning (see Materials and Methods). (F) Parameterization of different regimes in which neuronal assemblies are induced illustrating weak (k = 1; top) versus strong (k > 1; bottom) E-I coupling regimes. JIE = ∣JEI∣ = ∣JII∣ = kJEE. (G) Responses of NE excitatory and NI inhibitory neurons in a network with weak (k = 1; top) or strong (k = 4; bottom) E-I coupling to perturbations (10 pulses with Tp = 50, delivered to Np = 50 neurons, starting from T = 300). NE = NI = 500. (H) Average normalized change in the activity (Δ activity) of different subpopulations of neurons during induction relative to the baseline (BL). (I) Matrix of the covariance of response changes after perturbations in (G) and (H). Orange bars, perturbed ensembles. (J) Assembly formation is quantified by ensemble potentiation (Ensemble pot.; see Materials and Methods, Eq. 6) for different sizes of perturbed ensembles (Np) and temporal profiles (Tp). Credit: Science Advances, 10.1126/sciadv.abg8411
Neuronal assemblies are formed via the repetitive activation of subpopulations of neurons to guide learning and behavior. Technical advances have made it possible to artificially induce such assemblies, although the method of optimizing the various parameters remain to be identified. In a new report now published in Science Advances, Sadra Sadeh and Claudia Clopath at the Bioengineering department of the Imperial College London, U.K., studied this question in large-scale cortical networks with excitatory-inhibitory (E-I) balance. They identified the background network within which neuronal assemblies were embedded and how they strongly regulated their dynamics and formation. While networks with dominant excitatory interactions allowed the fast formation of neuronal assemblies, this process was accompanied by the recruitment of non-perturbed neurons for non-specific induction. Perturbation is a key technique in experimental systems neuroscience and can assist researchers establish how given neurons are causally related to a given behavior or to a succeeding neuronal activity. The results of this work highlighted the presence of two regions accompanying computational and cognitive tasks with speed and specificity.
Understanding the brain by studying neuronal assemblies
Neuronal assemblies or subgroups of interconnected, co-active neurons are the building blocks of computation and learning in the brain. With advancing technologies, scientists have gathered unprecedented tools to interact with the circuitry to record and perturb the activity of neuronal subpopulations and link their dynamic behavior. For instance, experimentalists can artificially induce neuronal assemblies by targeting the activation of a subset of cortical neurons and the efficient induction can provide a powerful method to trigger or suppress a behavior to guide the study of the human brain. Researchers aim to understand how the parameters of stimulation and the activation of neurons during perturbation techniques can be optimized for efficient induction. To study neuronal assemblies under biological conditions, researchers must assess the complex interplay of network dynamics and plasticity. In this work, Sadeh et al. studied how neuronal assemblies could be induced in large-scale recurrent networks of excitatory and inhibitory neurons under different conditions of perturbation. Using a theory developed recently to analyze the effect of neuronal perturbations, the team asked how activity changes resulting from different perturbations guided network-wide plasticity. In the first experimental step, they studied the transfer of input perturbations to output responses and analyzed the correlated activity patterns emerging from these responses to modify the neuronal assemblies.
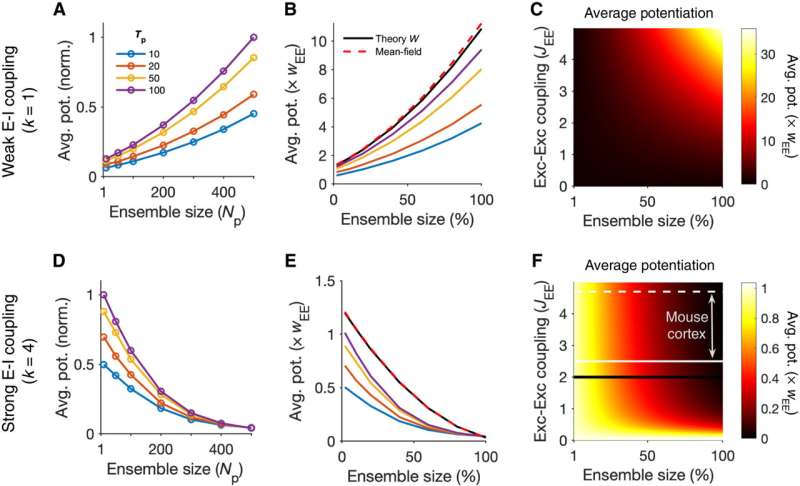
Transition from cooperative to suppressive regimes. (A) Average potentiation (Avg. pot.) of individual synapses within the ensemble of perturbed neurons for different ensemble sizes (Np) and temporal profiles of perturbation (Tp) normalized to the maximum. (B) Values of average potentiation relative to the average E-E weights in the network (wEE), compared with the theoretical values obtained from linearized dynamics of the network based on its weight matrix (theory W) and from the mean-field analysis (dashed line) (see Materials and Methods for details). The results of simulations for larger Tp values converge to the theoretical values inferred from W, which, in turn, match with the mean-field analysis. Ensemble size is expressed as a fraction of total E neurons in the network (Np/NE, where NE = 500). Other parameters are the same as Fig. 1. Networks are in the weak E-I coupling regime (k = 1). (C) Average potentiation relative to wEE calculated from the mean-field analysis for different combination of network E-E coupling (JEE = NE wEE) and the size of perturbed ensembles as a fraction of the total size of the network (Np/NE). (D to F) Same as (A) to (C) for perturbed ensembles in networks with strong E-I coupling (k = 4). The black line in (F) corresponds to previous simulations in (D) and (E) with JEE = 2. White lines indicate the range of JEE estimated in mouse cortical networks with the solid and dashed lines corresponding to the mode (JEE = 2.5) and the median (JEE = 4.7) of the estimated values. Credit: Science Advances, 10.1126/sciadv.abg8411
Inducing neuronal assemblies in excitatory inhibitory networks
The research team then investigated the formation of neuronal assemblies by analyzing the different patterns of perturbations in large-scale cortical network models with balanced excitation and inhibition. Thereafter, they simulated the networks composed of these models using random recurrent connectivity. Sadeh et al. characterized the induction protocols based on key methods of the perturbations, including the number of targeted neurons and properties of the stimulus. Next, they simulated the response of the network before and after perturbations in each regime to show the dominance of excitatory recurrent interactions for non-perturbed excitatory neurons during weak excitation-inhibition coupling. In contrast, nonperturbed excitatory neurons in networks with strong excitatory-inhibitory coupling showed dominance of inhibitory recurrent interactions, where both effects were stronger when increasing the size of the perturbed ensemble in the study.
Transactions in cortical networks
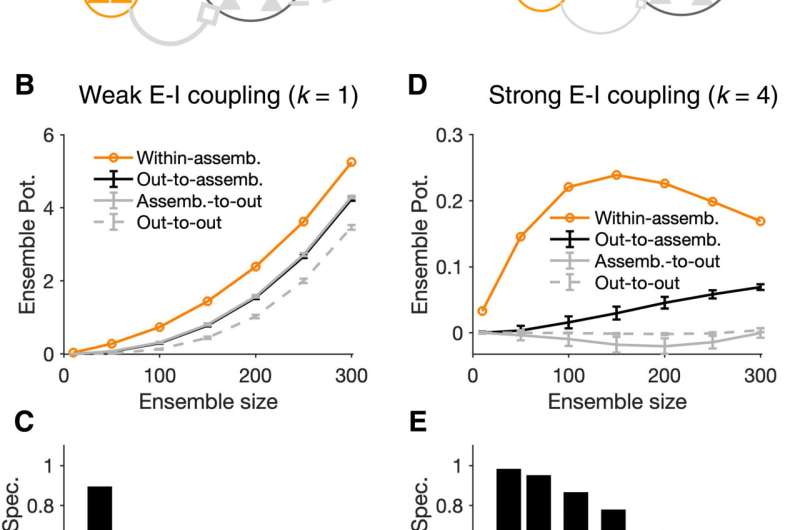
Specificity of assembly formation in different regimes of E/I balance. (A) The outcome of induction can be nonspecific (left), if the within-assembly potentiation of weights is accompanied by a substantial potentiation of connections originating from outside the perturbed ensemble, or specific (right), when the potentiation of weights remains constrained to the intended, perturbed ensemble. (B) Potentiation of presynaptic connections within the assembly (orange) versus those from the assembly to outside (assemb.-to-out; gray), from outside to the assembly (out-to-assemb.; black), and within the neurons outside the assembly (out-to-out; gray dashed), respectively. Tp = 50 and induction is in the weak E-I coupling regime (k = 1). Ensemble potentiation is calculated as the average (across postsynaptic neurons) of the sum of connection weights from all presynaptic sources (cf. Fig. 1J). For each Np, out-of-assembly potentiation is calculated for 100 randomly selected pools of neurons other than, but with the same size (Np) as, the perturbed neurons. Line and error bars show the average and SD across the pools, respectively. (C) Ensemble specificity (Spec.) quantifies the specificity of induced assemblies for different sizes of perturbed neurons. It is calculated as (Ew – Eo)/(Ew + Eo), where Ew and Eo are the average within- and out-of-assembly (assemb.-to-out) ensemble potentiation in (B), respectively. Ensemble specificity drops for larger ensemble sizes, reflecting the fact that within-assembly potentiation of weights is accompanied by a substantial potentiation of connections from outside. (D and E) Same as (B) and (C) for neuronal assemblies forming in networks with strong E-I coupling (k = 4). Out-of-assembly potentiation grows much slower than within-assembly potentiation initially until the latter plateaus and starts to drop (D), leading to a higher ensemble specificity for all ensemble sizes (E). Credit: Science Advances, 10.1126/sciadv.abg8411
To further understand the formation of assemblies in diverse regions, Sadeh et al. studied how the average strength of individual synapses changed as a function of parameters of perturbation. In the ensemble of perturbed neurons, they plotted the average potentiation of synapses for different regions and showed how cooperativity during the formation of neuronal assemblies emerged in networks with weaker E-I (excitatory-inhibitory) coupling. This changed to suppressive effects in networks with stronger interactions. Pre-existing wiring in the network guided the process and connections between neurons could be organized according to their functional properties. Cortical networks could typically regulate their activity after sensory deprivation such as injury or input deprivation, where neuronal assemblies were involved during subnetwork-specific recovery. To understand this process, Sadeh et a. reduced the feedforward input to a compartment of neurons in the network and studied how correlated external activation of a subset led to recovery. The results showed how strong E-I (excitatory-inhibitory) interactions shaped the formation of specific neuronal assemblies in the network and their recovery consequent to input deprivation.
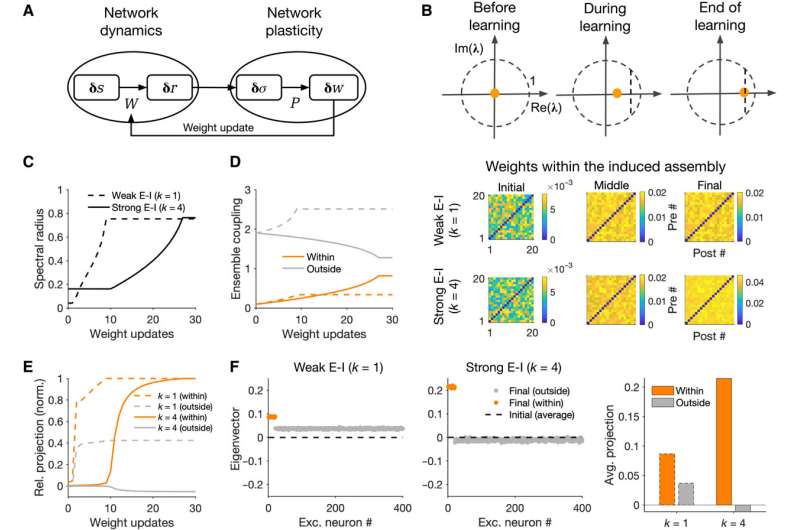
Growth of ensembles in networks with recurrent interaction of dynamics and plasticity. (A) Closed-loop interaction of network dynamics and network plasticity underlying the formation and growth of neuronal assemblies. Network dynamics governed by the weight matrix (W) determines the input-output responses to external perturbations, which, in turn, shape the structure of covariances. Network plasticity (P) guided by the resulting covariance patterns determines the weight changes and updates, on a slower time scale, the weight matrix, which, in turn, modifies the network dynamics. (B) Top: Spectral radius of the network denoting the growth of the maximum eigenvalue of the weight matrix (λ0) at different steps of weight update. To avoid instability of the network dynamics (λ0 > 1), the learning is stopped before λ0 reaches a threshold close to 1 (vertical dashed line). Bottom: Sample weight matrices of the perturbed ensemble at different stages for networks in different E/I regimes. Np = 20, Tp = 50; other parameters the same as in Fig. 2. (C) Evolution of the spectral radius in different regimes. (D) Ensemble coupling (mean-field coupling of the populations) within the perturbed ensemble (orange) and from neurons outside the perturbed ensemble to the ensemble (gray) (cf. Fig. 3, B and D) at different weight updates (dashed, k = 1; solid, k = 4). (E) Relative projection of the eigenvector (v0) corresponding to the largest eigenvalue (λ0) of the network over neurons within (orange) and outside (gray) the perturbed ensemble for networks with k = 1 (dashed) and k = 4 (solid). It is calculated as the average real part of the entries corresponding to perturbed and nonperturbed neurons normalized by the maximum value for each regime. (F) Left: Distribution of the real part of the largest eigenvector (v0) over excitatory neurons at the end of learning. Dashed line, the average value (across excitatory neurons) of the initial distribution before induction. Right: Average projection of the final eigenvector over excitatory neurons within and outside the perturbed ensemble. Credit: Science Advances, 10.1126/sciadv.abg8411
Behavioral performances associated with neuronal assemblies
Neuronal assemblies are also associated with different stimuli to guide and trigger behavior. Sadeh et al. next sought to understand how neuronal assemblies formed in different E-I regions contributed to behavioral performance by simulating the development of two neuronal assemblies associated with distinct stimuli. Networks with weak E-I coupling swiftly increased in recall strength to represent the capacity of the network to detect the presence of a stimulus. Based on the outcomes, neuronal assemblies amplified a weak stimulation of a small fraction of their neurons to provide a substrate for fast and strong recalls. In networks with strong E-I coupling, the recall strength was comparatively weaker, rising up more slowly. The results highlighted the slower emergence of neuronal assemblies in inhibition-dominated regions, while comparatively, the assemblies formed in weaker E-I regions were fit for faster, yet more crude cognitive tasks. The researchers showed how they can regulate different modes of learning by modulating the E-I balance in the network via top-down mechanisms to provide a powerful method. The team achieved different modes of learning and induction, by generally modulating the network followed by studies on dynamic transitions between different regions of excitatory-inhibitory (E-I) plasticity to show how different plasticity rules shaped the dynamics of learning in different manners.
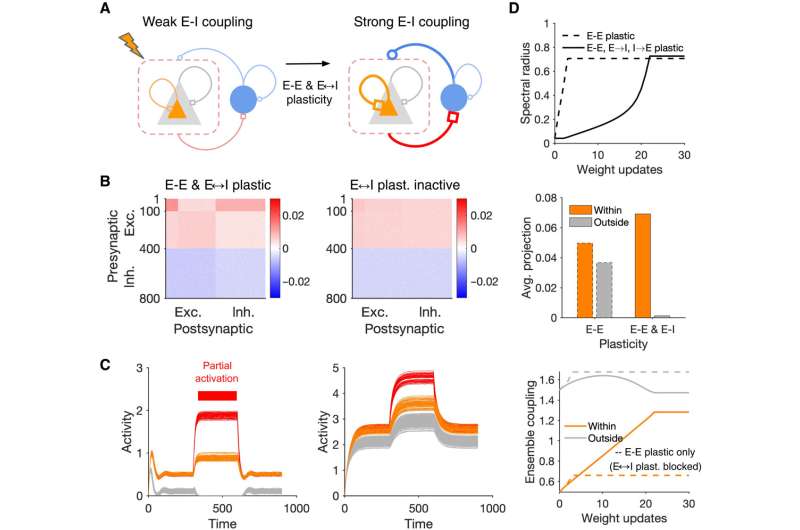
Dynamic transitions between different regimes of assembly formation. (A) Schematic of a network with E-E and E-I plasticity before and after induction of assemblies. (B) Final weight matrix of the network at the end of learning in the network where both E-E and E-I weights are plastic (left) compared with the condition where E-I plasticity is blocked and only E-E plasticity remains (right). NE = NI = 400, Np = 100 (perturbed neurons #1 to 100). (C) Pattern completion in networks with E-E and E-I plasticity (left) and only E-E plasticity (right) at the end of learning. (D) Growth of the spectral radius (top), average projection of the largest eigenvector over excitatory neurons (middle), and evolution of ensemble coupling (bottom) in the networks with E-E and E-I plasticity (solid lines) and when E-I plasticity is blocked (dashed lines). Credit: Science Advances, 10.1126/sciadv.abg8411
Outlook
In this way, Sadra Sadeh and Claudia Clopath studied how different patterns of perturbations induced neuronal assemblies in large-scale networks with excitation-inhibition (E-I) balance. The work highlighted the significance of studying the dynamics of neuronal networks and network-wide plasticity to cast light to the formation of neuronal assemblies. They credited the observed unexpected results to recurrent interactions within networks of excitatory and inhibitory neurons. Since behaviorally relevant learning was ultimately occurring in ensembles of neurons embedded in large-scale recurrent networks, the team sought to understand the impact of background on the formation of neuronal assemblies and learning by developing a computational network.
More information: Sadra Sadeh et al, Excitatory-inhibitory balance modulates the formation and dynamics of neuronal assemblies in cortical networks, Science Advances (2021). DOI: 10.1126/sciadv.abg8411
Alan R. Mardinly et al, Precise multimodal optical control of neural ensemble activity, Nature Neuroscience (2018). DOI: 10.1038/s41593-018-0139-8
Journal information: Science Advances , Nature Neuroscience
© 2021 Science X Network
