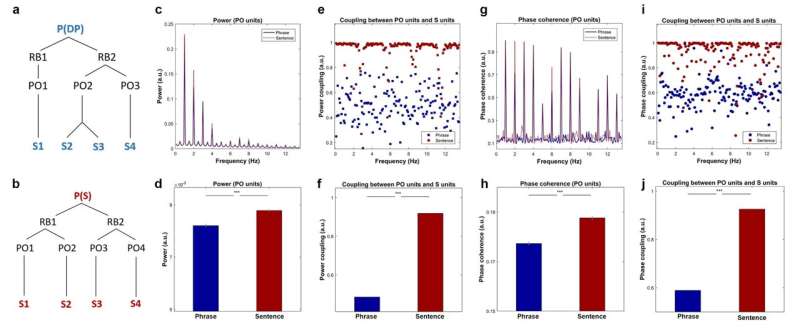
Simulation results based on the time-based binding hypothesis. (a) and (b). The model representation of phrases and sentences, in which the P (Proposition units), RB (Role-filler units), PO (Propositional Object units) and S (syllables units) represent the different types of node in DORA. P(DP) represents the top-level unit is a determiner phase and P(s) represents the highest-level unit is a sentence. (c). Simulation results on power, in which the red dotted line and blue solid line represent the frequency response of the sentences and the phrases, respectively. The shading area covers two s.e.m centered on the mean. (d). Statistical comparison on the frequency combined power using paired sample t-test suggested that the power for the sentences was significantly higher than the phrases (t (99) = 8.40, p < 3.25e-13, ***). (e). Results of power coupling between PO-units and S-units, where the red and blue squares show the frequency separated coupling level for the sentences and the phrases, respectively. (f). Statistical comparison on the level of power coupling using paired sample t-test suggested that the power coupling level for the sentences was significantly higher than the phrases (t (99) = 251.02, p < 1e-31, ***). (g). Results of phase coherence, in which the red-dotted line and blue-solid line shows the phase coherence of the sentences and the phrases, respectively. The shading area represents two s.e.m centered on the mean. (h). Statistical comparison of the phase coherence was conducted using paired sample t-test on the frequency averaged response. The comparison indicates that the phase coherence of the sentences was significantly higher than that of the phrases (t (99) = 10.24, p < 1e-20, ***). (i). Phase coupling between PO-units and S-units, the red and blue circles show the level of phase synchronization of the sentences and the phrases, respectively. (j). Statistical comparison on the level of phase coupling between the phrases and the sentences using paired sample t-test suggested that the phase coupling level for the sentences was significantly higher than the phrases (t (99) = 296.03, p < 1e-39, ***). The underlying data can be found in https://doi.org/10.5281/zenodo.6595789. Credit: Fan Bai, Antje S. Meyer and Andrea E. Martin
The brain links incoming speech sounds to knowledge of grammar, which is abstract in nature. But how does the brain encode abstract sentence structure? In a neuroimaging study published in PLOS Biology, researchers from the Max Planck Institute of Psycholinguistics and Radboud University in Nijmegen report that the brain encodes the structure of sentences ("the vase is red") and phrases ("the red vase") into different neural firing patterns.
How does the brain represent sentences? This is one of the fundamental questions in neuroscience, because sentences are an example of abstract structural knowledge that is not directly observable from speech. While all sentences are made up of smaller building blocks, such as words and phrases, not all combinations of words or phrases lead to sentences. In fact, listeners need more than just knowledge of which words occur together: they need abstract knowledge of language structure to understand a sentence. So how does the brain encode the structural relationships that make up a sentence?
Lise Meitner Group Leader Andrea Martin already had a theory on how the brain computes linguistic structure, based on evidence from computer simulations. To further test this "time-based" model of the structure of language, which was developed together with Leonidas Doumas from the University of Edinburgh, Martin and colleagues used EEG (electroencephalography) to measure neural responses through the scalp. In a collaboration with first author and Ph.D. candidate Fan Bai and MPI director Antje Meyer, she set out to investigate whether the brain responds differently to sentences and phrases, and if this could hint at how the brain encodes abstract structure.
-
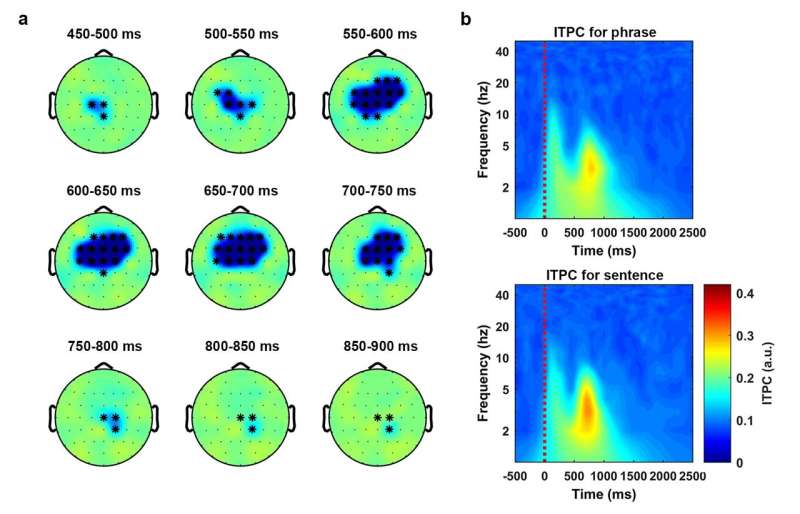
Statistical analysis on the phase coherence (ITPC) was conducted using a non-parametric cluster-based permutation test (1000 times) on a 1200-ms time window, which started at the audio onset and over the frequencies from 2 Hz to 8 Hz. The results indicated that the phase coherence was higher for the sentences than the phrases (p < 1e-4 ***, two-tailed). (a) The temporal evolution of the cluster that corresponds to the separation effect. The activity was drawn using the ITPC of the phrases minus the ITPC of the sentences. The topographies were plotted in steps of 50 ms. (b) ITPC averaged over all the sensors in the cluster. The upper panel and the lower panel show the ITPC of the phrases and the sentences, respectively. The underlying data can be found in https://doi.org/10.5281/zenodo.6595789. Credit: Fan Bai, Antje S. Meyer and Andrea E. Martin
-
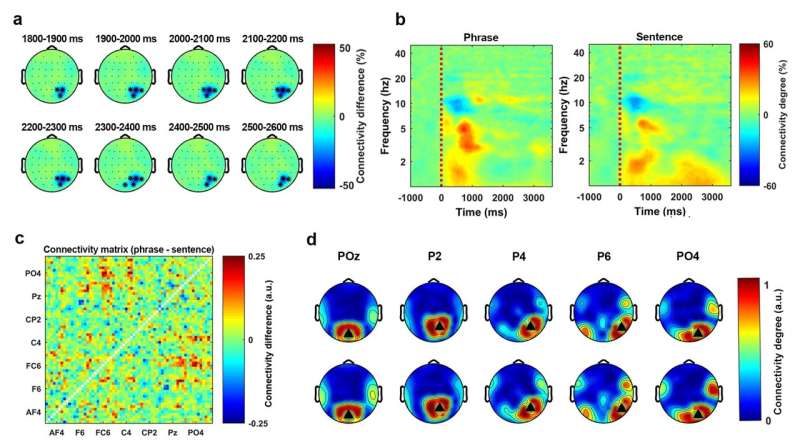
Statistical analysis on the phase connectivity degree was conducted using a non-parametric cluster-based permutation test (1000 times) on a 3500-ms time window, which started at the audio onset and over the frequencies from 1 Hz to 8 Hz. The results indicated that the phase connectivity degree was higher for the sentences than the phrases (p < 0.01**, two-tailed). (a) The temporal evolution of the cluster. The activity was drawn by using the averaged connectivity degree of the phrases minus the connectivity degree of the sentences. The topographies were plotted in steps of 100 ms. (b) The time-frequency decomposition of the connectivity degree, which was averaged over all the sensors in the cluster. The left and the right panel show the connectivity degree of the phrase condition and the sentence condition, respectively. (c) The matrix representation of the phase connectivity differences between the phrases and the sentences. The figure was drawn by using the averaged connectivity matrix of the sentences minus the averaged connectivity matrix of the phrases. (d) All the sensors in this cluster were used as the seed sensors to plot the topographical representation of the phase connectivity. The upper panel and the lower panel show the phase connectivity of the phrases and the sentences, respectively. The underlying data can be found in https://doi.org/10.5281/zenodo.6595789. Credit: Fan Bai, Antje S. Meyer and Andrea E. Martin
-
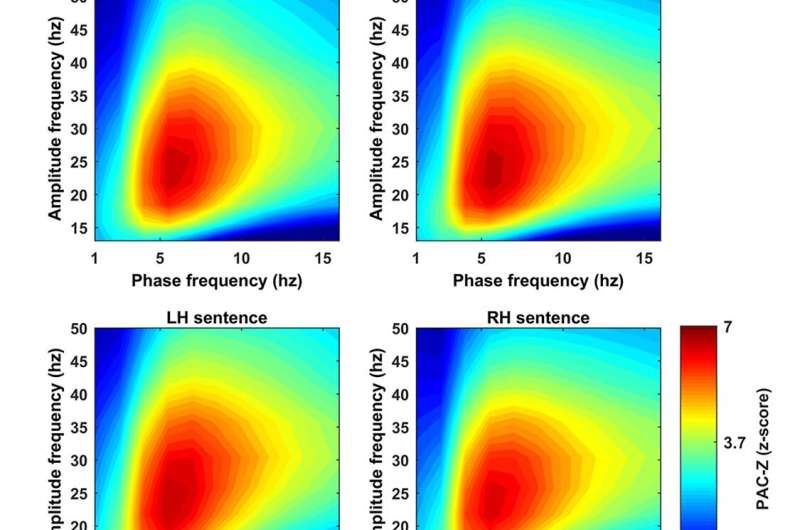
The figure shows a z-score transformed phase amplitude coupling, PAC-Z. (a) The PAC-Z for the phrases and the sentences at each hemisphere. Each figure was created by averaging 8 sensors which showed the biggest PAC-Z over the ROI. A z-score transformation with Bonferroni correction was conducted to test the significance, which lead to the threshold to be 3.73 corresponding to p-value equals 0.05. (b) The figure shows how sensors were selected at each hemisphere. The bigger the red circle indicates the more times this sensor was selected across participants. (c) The topographical distribution of the PAC-Z, which indicates the PAC was largely localized at the bilateral central areas. The underlying data can be found in https://doi.org/10.5281/zenodo.6595789. Credit: Fan Bai, Antje S. Meyer and Andrea E. Martin
The researchers created sets of spoken Dutch phrases (such as "de rode vaas," "the red vase") and sentences (such as "de vaas is rood," "the vase is red"), which were identical in duration and number of syllables, and highly similar in meaning. They also created pictures with objects (such as a vase) in five different colors. Fifteen adult native speakers of Dutch participated in the experiment. For each spoken stimulus, they were asked to perform one of three tasks in random order. The first task was structure-related, as participants had to decide whether they had heard a phrase or a sentence by pushing a button. The second and third task were meaning-related, as participants had to decide whether the color or object of the spoken stimulus matched the picture that followed.
As expected from computational simulations, the activation patterns of neurons in the brain were different for phrases and sentences, in terms of both timing and strength of neural connections. "Our findings show how the brain separates speech into linguistic structure by using the timing and connectivity of neural firing patterns. These signals from the brain provide a novel basis for future research on how our brains create language," says Martin.
-
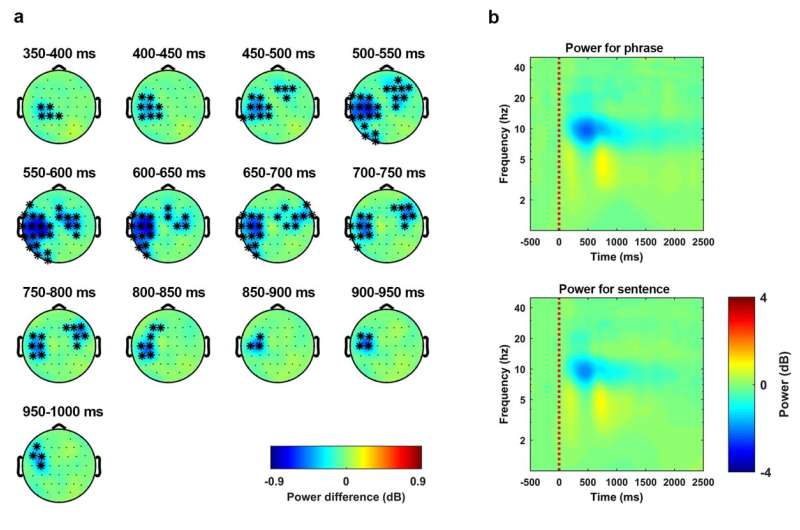
Statistical analysis on the induced activity was conducted using a non-parametric cluster-based permutation test (1000 times) on a 1000-ms time window, which started at the audio onset and over the frequencies from 7.5 Hz to 13.5 Hz. The results indicated that the phase coherence was higher for sentences than phrases (p < 0.01 **, two-tailed). (a) The temporal evolution of the cluster that corresponds to the discrimination effect. The activity was drawn by using the averaged induced power of the phrases minus the averaged induced power of the sentences. The topographies were extracted in steps of 50 ms. (b) Induced power averaged over all the sensors in this cluster. The upper panel and the lower panel show the induced power of the phrases and the sentences, respectively. The underlying data can be found in https://doi.org/10.5281/zenodo.6595789. Credit: Fan Bai, Antje S. Meyer and Andrea E. Martin
-
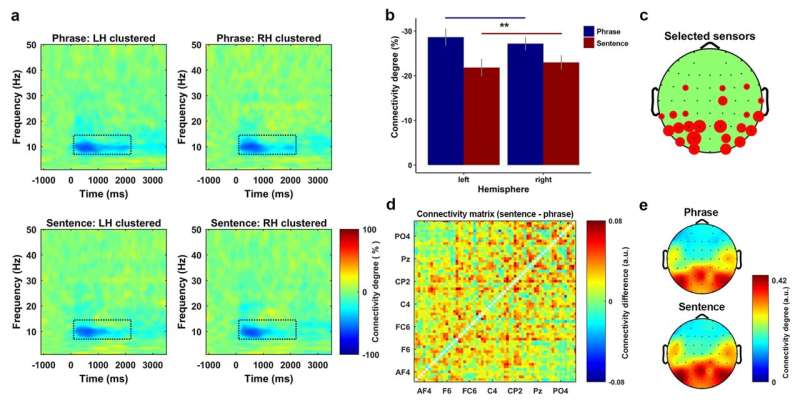
Power connectivity degree for all conditions. Each plot was clustered by the sensors at each hemisphere that showed the biggest inhibition on the grand averaged power connectivity. (b) The results of a two-way repeated measure ANOVA for the power connectivity on the factors of stimulus-type (phrase or sentence) and hemisphere (left or right). The results indicate a significant main effect of stimulus-type, post hoc comparison on the main effect indicated that the overall inhibition level of the power connectivity was stronger for the phrases than the sentences (t (29) = 2.82, p = 0.0085 **, two-sided). (c) How sensors were selected for the clustering. The bigger the red circle indicates the more times the sensor was selected across participants. (d) The connectivity differences between the phrases and the sentences on all sensor-pair. The figure was drawn using the average of the binarized connectivity matrix of the sentences minus the matrix of the phrases. The results indicate that the connectivity degree over the sensor space for the sentences was higher than the phrases. (e) Topographical representation of the binarized connectivity, which was clustered using the sensors showed biggest inhibition on the power connectivity. The upper and lower panel shows the phrase and sentence condition, respectively. The underlying data can be found in https://doi.org/10.5281/zenodo.6595789. Credit: Fan Bai, Antje S. Meyer and Andrea E. Martin
-
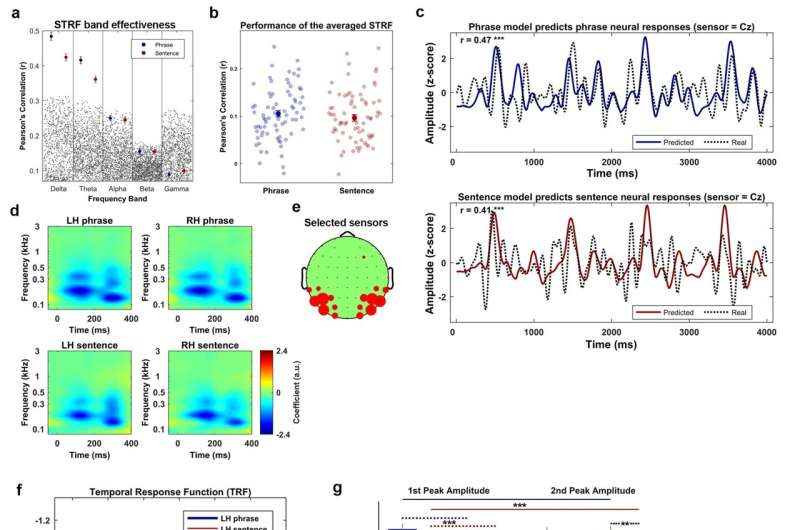
Comparison between the real performance and the random performance of the STRF in each canonical frequency band. The results suggested that only the performance of the STRF in the Delta band (< 4 Hz) and Theta band (4-8 Hz) was statistically better than the random performance. The blue and red dots represent the real performance of the STRFs for the phrases and the sentences, respectively. The error bar represents two s.e.m centered on the mean. The gray dots represent the random performance drawn by permutations. (b) The performance of the low-frequency range (< 8 Hz) STRF averaged across all participants. The solid blue and red dot represent the averaged performance across all testing trials. The error bar represents two s.e.m across the mean. The transparent blue and red dots represent the model's performance on each testing trial for the phrases and the sentences, respectively. The results indicate no performance difference on the kernel between the phrases and the sentences. (c) The comparison between the real neural response (dashed lines) and the model predicted response (solid blue for the phrase, solid red for the sentence) at a sample sensor Cz. The results suggest that the STRFs performed equally well for the phrases (r = 0.47, p<1e-5 ***, n=1024) and the sentences (r=0.41, p<1e-5 ***, n=1024). (d) The clustered STRF using the selected sensors showing the biggest activity (negative) on the ROI. The figure on the left and right side of the upper panel represents the clustered STRF for the phrases at the left and right hemisphere, respectively. The corresponding position of the lower panel represents the clustered kernel for the sentences. (e) The figure shows how the sensors were selected, in which the bigger the red circle represents the more times the sensor was selected across all participants. (f) The TRFs that were decomposed from the STRFs, in which the blue and red lines represent the phrases and the sentences, respectively. The solid and the dashed lines represent left and right hemisphere, respectively. (g) The comparison of the magnitude of the TRFs. The blue and the red bars represent the phrases and the sentences, respectively. The error bar shows 1 s.e.m across the mean on each side. A 3-way repeated measure ANOVA of the peak magnitude was conducted on the factors of Stimulus-type (phrase or sentence), Hemisphere (left or right) and Peak-type (~100 ms or ~300 ms). The results indicated a main effect of Stimulus-type and a 3-way interaction. The post hoc comparison on the main effect of Stimulus-type suggested that the amplitude (negative) was stronger for the phrase condition than the sentence condition (t (59) = 4.55, P < 2e-5 ***). To investigate the 3-way, Stimulus-type*Peak-type*Hemisphere, interaction, two 2-way repeated measure ANOVA with the Bonferroni correction were conducted on the factors of Hemisphere and Audio-type at each level of the Peak-type. The results indicated a main effect of Stimulus-type at the first peak (F (1, 14) = 8.19, p = 0.012 *) and a 2-way Hemisphere*Stimulus-type interaction at the second peak (F (1, 14) = 6.42, p = 0.023 *). At the first peak, a post hoc comparison on the main effect of Stimulus-type was conducted using a paired sample t tests, the results showed that the magnitude of the phrase condition was higher than the magnitude of the sentence condition (t (29) = 3.49, p = 0.001 ***). For the 2-way, Hemisphere*Stimulus-type, interaction at the second peak, the paired sample t tests with Bonferroni correction was conducted to compare the difference of the magnitude between the phrases and the sentences at each hemisphere. The results indicate that the magnitude at the second peak was stronger for the phrase condition than the sentence condition in the right hemisphere (t (14) = 3.21, p = 0.006 **), but not the left hemisphere (t (14) = 0.86, p = 0.40). (h) The comparison of the peak latency of TRFs, the blue and the red bars represent the phrases and the sentences, respectively. The error bar shows 1 s.e.m across the mean on each side. A 3-way repeated measure ANOVA of the peak latency was conducted on the factors of Stimulus-type (phrase or sentence), Hemisphere (left or right) and Peak-type (~100 ms or ~300 ms). The results indicated a main effect of Peak-type and a 3-way interaction. The post hoc comparison on the main effect of Peak-type suggested that the latency of the first peak was significantly faster than the second peak (t (59) = 38.89, p < 2e-16 ***). The post hoc comparison on the 3-way interaction with the Bonferroni correction on the factors of Hemisphere and Stimulus-type for each level of the Peak-type suggested a 2-way Hemisphere*Stimulus-type interaction at the first peak (F (1, 14) = 12.83, p = 0.002**). The post hoc comparison on this 2-way interaction using paired sample t tests with the Bonferroni correction indicated that the latency at the first peak was significantly longer for the sentences than the phrases at the right hemisphere (t (14) = 3.55, p = 0.003 **), but not the left hemisphere (t (14) = 0.58, p = 0.56). (i) The SRFs which were decomposed from the STRFs, in which the red and the blue lines represent the phrases and the sentences, respectively, the solid and the dashed lines represent the left and right hemisphere, respectively. (j) The comparison of the amplitude of the SRFs. The SRF was first separated into three bands, low (< 0.1 kHz), middle (0.1 to 0.8 kHz) and high (> 0.8 kHz) based on the averaged frequency response of the STRF, then a 3-way repeated measure ANOVA of the amplitude was conducted on the factors of Stimulus-type (phrase or sentence), Hemisphere (left or right) and Band-type (low, middle and high). The results indicated a main effect of Band-type (F (2, 28) = 119.67, p < 2e-14 ***) and a 2-way, Band-type*Stimulus-type, interaction (F (2, 28) = 27.61, p < 3e-7 ***). The post hoc comparison on the main effect of Band-type using paired sample t tests with Bonferroni correction showed that the magnitude of the middle frequency band was stronger than the low-frequency band (t (59) = 17.9, p < 4e-25 ***) and high frequency band (t (59) = 18.7, p < 5e-26 ***). The post hoc comparison using paired sample t tests with the Bonferroni correction on the, Band-type*Stimulus-type, interaction showed that the amplitude of the SRF was stronger for the phrases than the sentences only at middle frequency band (t (29) = 4.67, p < 6e-5 ***). The underlying data can be found in https://doi.org/10.5281/zenodo.6595789. Credit: Fan Bai, Antje S. Meyer and Andrea E. Martin
"Additionally, the time-based mechanism could in principle be used for machine learning systems that interface with spoken language comprehension in order to represent abstract structure, something machine systems currently struggle with. We will conduct further studies on how knowledge of abstract structure and countable statistical information, like transitional probabilities between linguistic units, are used by the brain during spoken language comprehension."
More information: Neural dynamics differentially encode phrases and sentences during spoken language comprehension, PLoS Biology (2022). DOI: 10.1371/journal.pbio.3001713
Journal information: PLoS Biology
Provided by Max Planck Society
