This article has been reviewed according to Science X's editorial process and policies. Editors have highlighted the following attributes while ensuring the content's credibility:
fact-checked
peer-reviewed publication
trusted source
written by researcher(s)
proofread
Who tracked UK COVID infections the best at the height of the pandemic? A new study provides the answer

At the height of the COVID pandemic everybody, from health ministers to Joe public, wanted to know two things: how many infected people are there in the country? And is this number going up or down?
There were many sources for these figures, from the Office for National Statistics to the Zoe app. We wanted to know which of these methods was the most reliable during the first two years of the pandemic. Our results have just been published in The Lancet Public Health.
In judging the effectiveness of the various surveillance methods, we looked at three criteria. First, to what degree did the method reflect whether cases were rising or falling? Second, how accurate was it in giving estimates of the actual infection numbers? And, third, was the data available swiftly enough for control measures, such as enhanced contact tracing, to be rapidly put in place?
The gold standard surveillance was the Office for National Statistics (ONS) COVID survey. This tested a random sample of people every two weeks and reported both the number of people likely to test positive and the number of new infections occurring every day.
The other big advantage of the ONS survey is that it picked up all infections, whether or not the person had symptoms (and you probably recall that many people were asymptomatic). But, by the time their results were reported, the data was usually a week or two out of date. Not good if you needed to quickly introduce new control measures.
The ONS survey was also very expensive, as it involved visiting tens of thousands of people each week to take swabs.
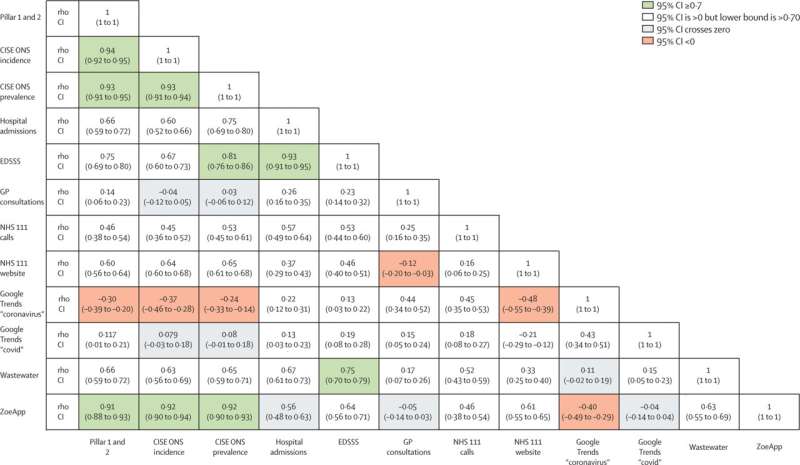
The number of new cases reported each day by the Department of Health on the COVID dashboard was much more up to date, being published within a couple of days of the swabs being taken. This data tracked the ONS estimates very closely, though the reported numbers were usually only about 45% of the ONS data. So a little less than half of all infections were being picked up by mass screening.
The Zoe app also tracked the ONS survey estimates closely and was a good estimate of whether infections were rising or falling. But, at times, the Zoe estimates were too high. Sometimes, it was also slow at spotting a fall in case numbers.
The Zoe app estimates were periodically adjusted to fit closer to the ONS survey estimates, raising the question of how good it would have been if it wasn't for the ONS data to calibrate its estimates.
For influenza surveillance, the UK relies heavily on GPs reporting people with influenza-like illness. However, for COVID this data source was very poor, not correlating at all with infection counts.
Using data on computer searches such as found in Google Trends has been used to track infectious diseases, especially Google Trends and influenza. Here again, there was very little correlation between infection numbers and Google Trend searches for either "COVID" or "coronavirus".
The number of people calling NHS 111 with COVID symptoms performed only slightly better.
We also examined use of the NHS 111 website to identify potential COVID cases, the number of patients suspected of having COVID at emergency departments, and hospital admissions. These were all moderately correlated with the ONS estimates.
Hospital admissions data tended to lag about a week behind changes in infection numbers, so did not provide timely information.
Wastewater surveillance, where assumptions are made about infection numbers in the population based on testing sewage for the presence of the virus, received a lot of interest during the COVID pandemic.
Testing of wastewater for poliovirus has a long history. But for poliovirus, detecting any circulating virus is enough to raise the alarm. For COVID, the question was can wastewater testing indicate how much infection is present in the population? In our analysis, we found that counts in wastewater were moderately correlated with the prevalence of COVID in the population.
Useful additional insights
No single surveillance method was ideal in England. But the most timely and consistent approach was reporting the results of routine testing on the COVID dashboard.
Other surveillance methods were unable to improve on this routine approach for timeliness and detection of trends.
Even so, the other approaches provided useful additional insights. For example, the Zoe app provided some of the earliest evidence that loss of the sense of smell was an important symptom of COVID.
The hospital admissions data and emergency department attendance methods provided important information on how the pandemic was affecting health services. NHS 111 call and website data provided useful information early in the pandemic, before other surveillance methods were established.
Although wastewater surveillance did little to increase our understanding of the course of the pandemic in England, this surveillance method may be useful in countries that don't have easy access to human testing.
Overall, the best indication of the course of the pandemic came not from relying on a single surveillance method but from considering the outputs from all available data sources.
More information: Julii Brainard et al, Comparison of surveillance systems for monitoring COVID-19 in England: a retrospective observational study, The Lancet Public Health (2023). DOI: 10.1016/S2468-2667(23)00219-0
This article is republished from The Conversation under a Creative Commons license. Read the original article.![]()


