Flu forecasts successful on neighborhood level

Scientists at Columbia University's Mailman School of Public Health developed a computer model to predict the onset, duration, and magnitude of influenza outbreaks for New York City boroughs and neighborhoods. They found the model effective in a test using data from 2008-2013; results appear in the journal PLOS Computational Biology.
The researchers are the first to successfully forecast influenza with this level of geographic granularity. "Much like weather forecasts, flu forecasts are most useful at the local level," says lead author Wan Yang, associate research scientist in the Department of Environmental Health Sciences. "Our goal is to provide information so individuals and public health authorities can take measures to prevent illness."
Yang and senior investigator Jeffrey Shaman, associate professor of Environmental Health Sciences, have previously demonstrated success forecasting the flu on the state and city level. In this study, they tested a new method to provide more localized predictions using data on incidence of influenza-like illness from 52 city emergency departments provided by the New York City Department of Health and Mental Hygiene combined with lab-verified regional flu levels from the U.S. Centers for Disease Control and Prevention. By incorporating information on daily population movement within the city (the paper uses the technical term, "network connectivity"), they report they were able to forecast influenza activity at a much more localized geographic scale.
"By adding information on the city's commuter patterns, we were able to boost signal, providing a much clearer picture on when outbreaks would take place, how long they would last, and how severe they might be," says Shaman. Like a weather forecast, flu predictions are made with varying degrees of certainty (for instance, an 80 percent change of a flu outbreak in the Bronx).
The model was able to predict a small uptick in flu activity one week in advance 82 percent of the time; it predicted larger spikes with less accuracy. For severe and ongoing outbreaks, it predicted outbreak duration with 77 percent accuracy. It could correctly estimate an outbreak's magnitude up to 54 percent of the time.
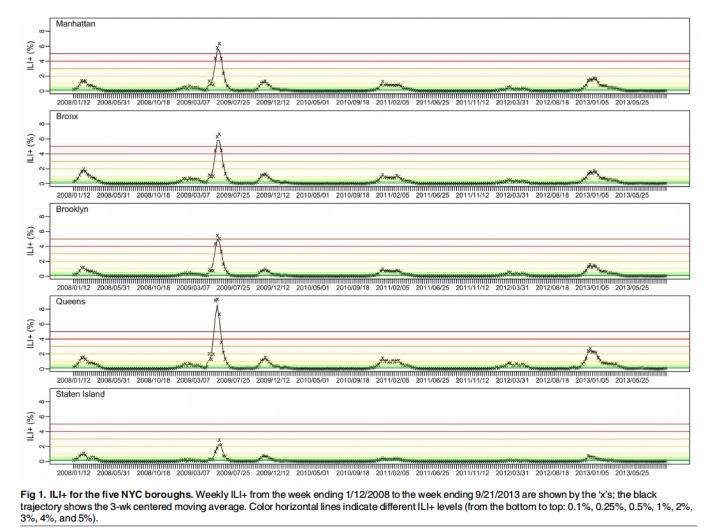
The researchers observed flu outbreaks occurring simultaneously in all five boroughs, including the 2009 pandemic, which was many times more intense than the other outbreaks during the six-year period. For reasons not understood, outbreaks were slightly more severe in Queens. Outbreaks in Staten Island were less intense; however, according to the researchers, this was an artifact as influenza-like illness in the borough was only recorded when a patient was hospitalized.
Among 42 neighborhoods corresponding to local hospital use, the researchers observed greater geographic variation in outbreak intensity and timing—sometimes weeks apart (video illustrating neighborhood-level outbreaks is available along with the published paper). Adding network connectivity at this level degraded neighborhood forecast accuracy—something the researchers say reflects the fact that connection between neighborhoods does not match with commuter flows. Ongoing work is exploring alternate data sources to refine neighborhood-level forecasts.
As of now, the researchers are not providing borough and neighborhood-level forecasts in real time. For real-time forecasts on the city level, visit the Columbia Prediction of Infectious Disease website, which reports weekly forecasts during the active flu season (as of November 30, 2016, activity remained low).


