This article has been reviewed according to Science X's editorial process and policies. Editors have highlighted the following attributes while ensuring the content's credibility:
fact-checked
peer-reviewed publication
trusted source
proofread
How the brain's 'internal compass' works

Scientists have gained new insights into the part of the brain that gives us a sense of direction, by tracking neural activity with the latest advances in brain imaging techniques. The findings shed light on how the brain orients itself in changing environments—and even the processes that can go wrong with degenerative diseases like dementia, that leave people feeling lost and confused.
"Neuroscience research has witnessed a technology revolution in the last decade, allowing us to ask and answer questions that could only be dreamed of just years ago," says Mark Brandon, an Associate Professor of psychiatry at McGill University and researcher at the Douglas Research Centre, who co-led the research with Zaki Ajabi, a former student at McGill University and now a postdoctoral research fellow at Harvard University.
Reading the brain's internal compass
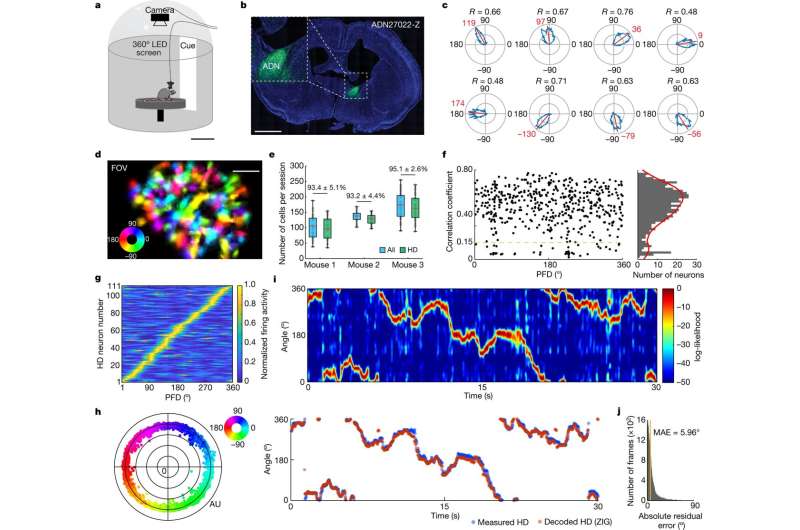
To understand how visual information impacts the brain's internal compass, the researchers exposed mice to a disorienting virtual world while recording the brain's neural activity. The team recorded the brain's internal compass with unprecedented precision using the latest advances in neuronal recording technology.
This ability to accurately decode the animal's internal head direction allowed the researchers to explore how the Head-Direction cells, which make up the brain's internal compass, support the brain's ability to re-orient itself in changing surroundings. Specifically, the research team identified a phenomenon they term "network gain" that allowed the brain's internal compass to reorient after the mice were disoriented.
"It's as if the brain has a mechanism to implement a 'reset button' allowing for rapid reorientation of its internal compass in confusing situations," says Ajabi.
Although the animals in this study were exposed to unnatural visual experiences, the authors argue that such scenarios are already relevant to the modern human experience, especially with the rapid spread of virtual reality technology. These findings "may eventually explain how virtual reality systems can easily take control over our sense of orientation," adds Ajabi.
The results inspired the research team to develop new models to better understand the underlying mechanisms. "This work is a beautiful example of how experimental and computational approaches together can advance our understanding of brain activity that drives behavior," says co-author Xue-Xin Wei, a computational neuroscientist and an assistant professor at The University of Texas at Austin.
Degenerative diseases
The research is published in the journal Nature. The findings also have significant implications for Alzheimer's disease. "One of the first self-reported cognitive symptoms of Alzheimer's is that people become disoriented and lost, even in familiar settings," says Brandon.
The researchers expect that a better understanding of how the brain's internal compass and navigation system works will lead to earlier detection and better assessment of treatments for Alzheimer's disease.
More information: Zaki Ajabi et al, Population dynamics of head-direction neurons during drift and reorientation, Nature (2023). DOI: 10.1038/s41586-023-05813-2


