This article has been reviewed according to Science X's editorial process and policies. Editors have highlighted the following attributes while ensuring the content's credibility:
fact-checked
peer-reviewed publication
trusted source
proofread
Rural counties show steeper decline in health measures compared to urban counties in 2015 vs. 2019

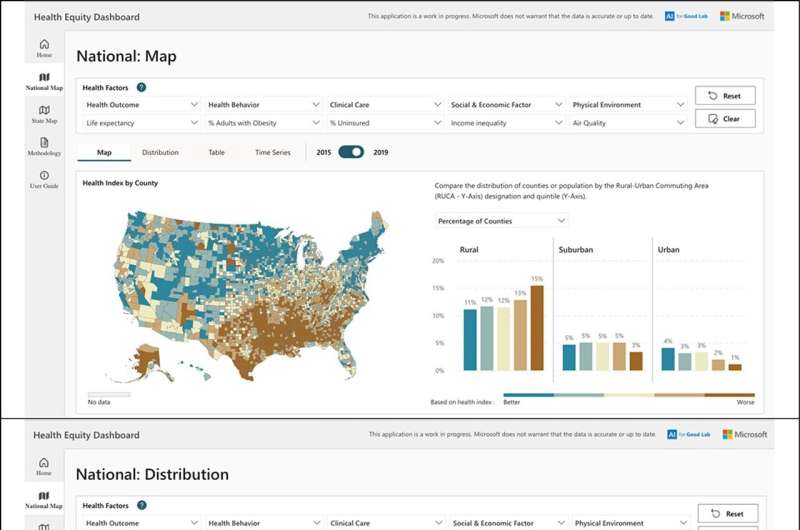
Residents of rural counties have overall worse health outcomes than their urban counterparts. A study published in PLOS Global Public Health by William Weeks at Microsoft Corporation, Redmond, Washington, United States and colleagues introduces a Health Equity Dashboard for policy makers to visualize health disparities in specific locations, and to examine the relationship between health-related measures and socio-demographic characteristics.
Despite overall decreasing mortality rates prior to 2020, health disparities between rural and urban areas in the United States have increased. To better understand inequities in health-related measures between rural and non-rural populations, researchers collected publicly available health data from 3,131 U.S. counties.
They classified counties as rural, suburban, or urban using the Centers for Disease Control and Prevention's 2013 Urban-Rural Classification Scheme for Counties, and analyzed how 33 county level attributes relating to health outcomes, clinical care, health behaviors, physical environment, or social and economic factors changed in 2015 compared to 2019.
Using this data, researchers developed a publicly available Health Equity Dashboard that could be used by policymakers and researchers to examine disparities within domains, to develop their own indices of up to five measures across a single or multiple domains, and to examine the relationship between health measures and socio-demographic characteristics.
The Health Equity Dashboard showed that, although health measures in general declined across all counties in 2019 as compared to 2015, the decline tended to be steeper in rural counties, resulting in an increased rural-urban disparity. Specifically, there was a statistically significant and progressive worsening of 22 of the 33 health measures (such as life expectancy, reported mental or physical health, food insecurity, obesity, smoking, etc.) when moving from urban to suburban to rural counties. (For the three measures of diabetes prevalence, preventable hospitalization, and deaths due to injury, values improved with increasing rurality.)
It's important to note the dashboard highlights relationships between geographic location and health-related variables which are correlated, but cannot be shown to be causative. Regardless, the dashboard underscores the need to prioritize rural settings for health and policy interventions in the United States.
According to the authors, "Our findings highlight the need for policymakers to prioritize rural settings for interventions designed to improve health outcomes. Timely, accurate, and high-quality data are a critical component of public health decision making. Data visualization tools can help the effective delivery and translation of data, thereby engaging key stakeholders and prompting action."
The authors add, "Using publicly available data, we developed a free, interactive health equity dashboard that can be used to examine county-level health inequities (available at aka.ms/healthequity). In their quest for health equity, communities and their leaders can use the tool to explore relationships between health and its social determinants and identify areas that are ripe for intervention."
More information: Weeks WB, Chang JE, Pagán JA, Lumpkin J, Michael D, Salcido S, et al, Rural-urban disparities in health outcomes, clinical care, health behaviors, and social determinants of health and an action-oriented, dynamic tool for visualizing them. PLOS Global Public Health (2023). DOI: 10.1371/journal.pgph.0002420 , journals.plos.org/globalpublic … journal.pgph.0002420


