August 27, 2019 feature
Noninvasive monitoring of chronic kidney disease (CKD) using pH and perfusion imaging

Chronic kidney disease (CKD) is a feature of inherited metabolic disorders such as methylmalonic acidimia (MMA), which can cause impaired growth and low metabolic activity to delay the diagnosis and management of renal disease. In a new report now published on Science Advances, KowsalyaDevi Pavuluri and colleagues at the interdisciplinary departments of Radiology and Radiological Science, Functional Brain Imaging, Metabolic Genetics and Pediatrics in the U.S., designed an alternative strategy to monitor renal function. The research team based the protocol on administering a pH sensitive MRI agent to assess disease progression in a mouse model of MMA. The study successfully facilitated the use of MRI for early detection and monitoring of CKD.
Organic acidemias are a group of rare inborn metabolic errors caused by the disturbances of amino acid metabolism that result in large, abnormal accumulations of toxic organic acids in tissues and fluids—including urine. Collectively, this group of inborn errors of metabolism can cause notable morbidity and mortality in infancy and childhood. As a result, these disorders are now routinely screened in newborn panels for early diagnosis and treatment. Scientists have established gene knockout and tissue-specific transgenic mouse models of MMA in research studies to resemble the human disease, due to its severity and ubiquity. Although early identification and treatment has improved the life expectancy and clinical course of MMA, patients remain at risk of chronic complications including CKD and renal failure.
Renal function can be determined using the standard index of glomerular filtration rate (GFR), since the direct measurement of GFR (mGFR) is invasive and cumbersome. As an alternative to mGFR, clinicians also routinely estimate GFR (eGFR) using creatinine and/or cystatin-C. However, the routine computation of serum biomarkers of renal disease is substantially altered in severely growth impaired and protein-restricted patients, while eGFR is limited to patients with asymptomatic renal disease. The development of alternative methods to detect early stage CKD while facilitating the treatment of associated comorbidities are still evolving, the techniques must also enable timely planning for renoprotection or renal replacement therapies, including transplantation to specific patient populations.

Research teams are therefore keen to develop new tools to detect renal disease to meet the needs of MMA and CKD populations. For instance, magnetic resonance imaging (MRI) can produce high resolution images with exquisite soft tissue contrast to detect renal pathologies. Researchers have also impressively measured functional information on kidney clearance or the count of glomeruli using MR contrast agents during renography. To create pH images most researchers have used chemical exchange saturation transfer (CEST) MRI as a premier technology. The technology can detect low concentrations of contrast agent by applying saturation pulses on labile (unstable) protons to destroy their magnetization and transfer the signal loss to water via chemical exchange. The resulting chemical shift dependence is an important feature able to discriminate between agents of multicolor or multifrequency MRI. For pH imaging studies, iopamidol is an excellent pH probe used and substantiated in previous studies.
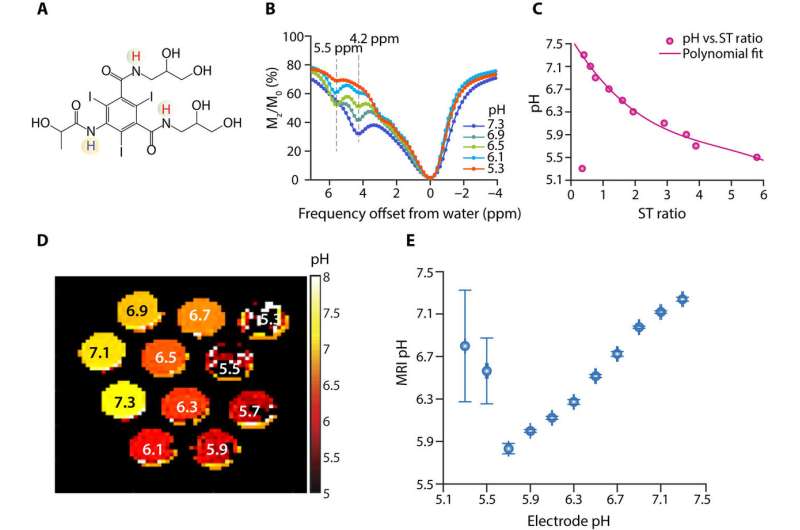
In the present work, Pavuluri et al. used CEST MRI to functionally image kidneys in an MMA mouse model and investigate the progression to CKD. They designed a time-efficient CEST MRI protocol to study a nonionic contrast agent known as iopamidol to yield perfusion and pH maps of the kidneys. The research team envision that the new method will determine mGFR (direct measurements of GFR) as a useful technique to diagnose and monitor CKD. The team first tested the pH sensitivity of iopamidol and assessed the pH mapping protocols across a range of pH values, followed by testing several radiofrequency (RF) saturation powers best suited for blood serum. Using the multifrequency pH mapping protocol developed in the work, the researchers measured pH values between 7.3 and 5.7, suited for live imaging animal studies.
![Contrast agent uptake for the four different groups of MMA mice. (A) Average iopamidol uptake with time for RD Mut+/− and RD Mut−/− mice. RD Mut+/− mice display higher uptake of contrast agent [>25% (n = 5)] than RD Mut−/− mice [>12% (n = 4)]. (B) Average iopamidol uptake with time for HP Mut+/− and HP Mut−/− mice. Similar to RD Mut+/− mice, >25% contrast was observed for HP Mut+/− mice. HP Mut−/− mice displayed the lowest contrast [~4% (n = 3)], indicating the lowest iopamidol uptake for these mice with more advanced kidney disease. (C and D) Corresponding time-averaged maximum contrast images of RD Mut+/− and RD Mut−/− mice. (E and F) Maximum contrast images of HP Mut+/− and HP Mut−/− mice. Science Advances, doi: 10.1126/sciadv.aaw8357 Noninvasive monitoring of chronic kidney disease (CKD) using pH and perfusion imaging](https://scx1.b-cdn.net/csz/news/800a/2019/3-noninvasivem.jpg)
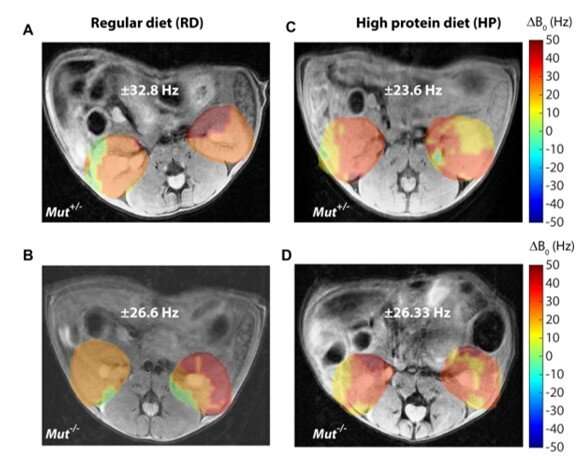
Subsequently, they developed an in vivo CEST MRI protocol to study a mouse model of MMA carrying a mutation (Mut−/−) and displaying varying degrees of kidney disease within four groups alongside control littermates (Mut+/−). Preceding research work had shown that exposure to a high protein diet caused a massive elevation of biomarkers related to CKD in the mutant animals. The research team administered iopamidol to the animals and acquired CEST MRI data and observed the strongest contrast in the control mice and the weakest contrast in the mutant mice on a high protein diet. The results on iopamidol uptake could thus differentiate between groups during early disease progression.

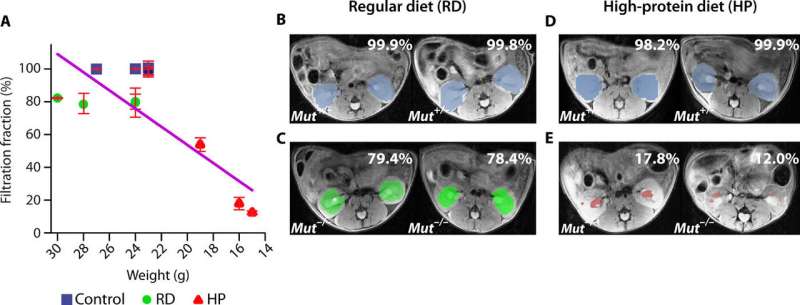
The research team compared the perfusion results and filtration fraction (FF; metric of perfusion) across all groups of MMA mice by test imaging with iopamidol to detect kidney disease. Control animal models on the regular diet and high protein diet displayed FF > 98 percent, whereas animal models with moderate kidney disease displayed a moderate reduction in iopamidol perfusion (FF, ~79 percent). Furthermore, animal models with severe kidney disease displayed a substantial reduction in iopamidol perfusion (FF, ~50 percent).
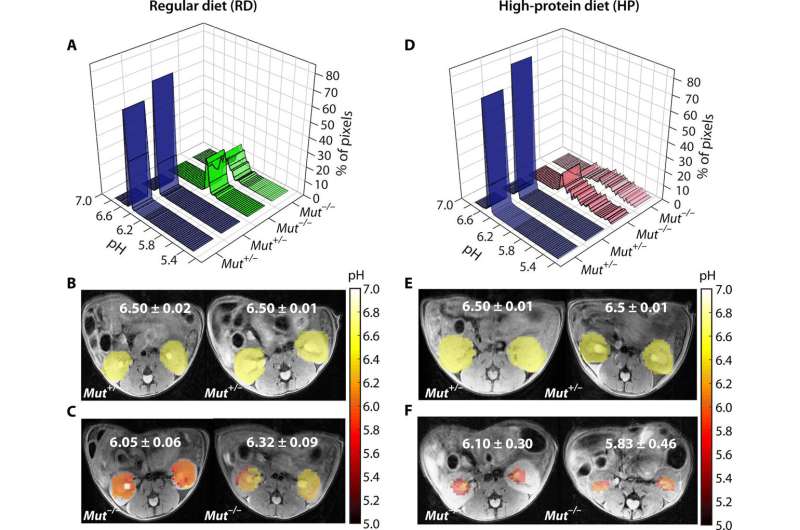
To establish the suitability of the MRI protocol, Pavuluri et al. obtained pH maps using the CEST MRI data for the four groups of mice. Regular diet and high protein diet fed control mice displayed homogenous pH values of 6.50 across the entire kidney slice imaged. In contrast mutant mice on a regular diet displayed a lower average pH (~6.1) and mutant mice on a high protein diet showed slightly lower pH (~6.0). The in vivo imaging data were also consistent with the blood work and weights of the animals obtained in the study.

In this way, KowsalyaDevi Pavuluri and co-workers developed a new CEST MRI protocol based on iopamidol administration to test perfusion and detect pH changes in mice exhibiting different stages of renal function. The research team used filtration fraction (FF) as the metric of perfusion to estimate isopamidol perfusion through the kidneys due to minimal modeling required to measure it. Based on the results, Pavuluri et al. determined the new CEST MRI protocol as a promising technique to assess disease progression in time. The method facilitated treatment responses in animal models of kidney disease, with potential for immediate translation in patients with disorders similar to MMA.
More information: Devi Pavuluri et al. Noninvasive monitoring of chronic kidney disease using pH and perfusion imaging, Science Advances (2019). DOI: 10.1126/sciadv.aaw8357
I. Manoli et al. Targeting proximal tubule mitochondrial dysfunction attenuates the renal disease of methylmalonic acidemia, Proceedings of the National Academy of Sciences (2013). DOI: 10.1073/pnas.1302764110
Friederike Hörster et al. Long-Term Outcome in Methylmalonic Acidurias Is Influenced by the Underlying Defect (mut0, mut−, cblA, cblB), Pediatric Research (2007). DOI: 10.1203/PDR.0b013e3180a0325f
© 2019 Science X Network


