We can 'shrink' the COVID-19 curve, rather than just flatten it

Leaders and officials who are currently making crucial decisions about responses to COVID-19 can take heart that "flattening" the epidemic curve will not inevitably result in a need to apply drastic social distancing measures over a much longer period of time: our epidemiological simulation models show that public health interventions can do more than just "flatten" the COVID-19 epidemic curve. These measures, in particular intensive case-finding and strict enforcement of isolation and quarantine, can potentially "shrink" the curve, resulting in many fewer cases and deaths overall, with minimal or no extension to the duration of the epidemic.
What do we mean by "flattening the curve"?
"Flattening the curve" has rapidly become a rallying cry in the fight against COVID-19, popularized by media outlets and leaders worldwide. The COVID-19 "flattening the curve" infographic, which seems to have first appeared in The Economist on 29 February 2020, has entered our collective consciousness. Ubiquitous versions of this infographic depict "flattening" of the curve as a reduction in the peak number of cases, thereby helping to prevent the health system from being overwhelmed. But they also suggest worrying consequences: "flattening" approximately doubles the duration of the epidemic, and the total burden of cases remains the same. This implies that social distancing measures and management of cases, with their devastating economic and social impacts, may need to continue for twice as long if we go all-out to "flatten the curve." However, there appears to be no empirical basis to the idea that "flattening the curve" lengthens the epidemic, which is what we wanted to explore with our modelling.
A stochastic individual contact model
To better understand the impact of public health interventions on the COVID-19 epidemic curve, we have constructed a stochastic individual contact model—i.e. a model that incorporates much of the randomness and unpredictability of real life at the individual level, such as chance meetings or contact with potentially infectious strangers. This allowed us to simulate spread in a hypothetical population of 100,000 people under different intervention strategies. The model permits tweaking of multiple parameters relating to the epidemiology of the virus and specific interventions, unlike simpler models.

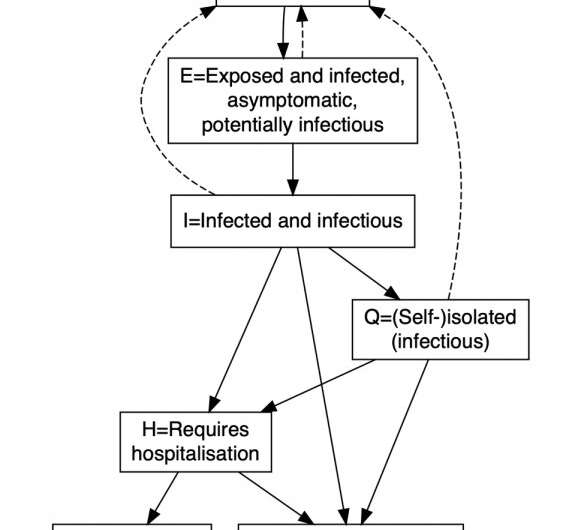
Our model allocates each member of its hypothetical population to one of seven compartments. The dashed arrows represent interpersonal interactions through which transmission of infection may occur. The solid arrows include possible transitions between compartments.
We modeled intervention scenarios by varying the number of times individuals in the various compartments interact with each other. The baseline case assumes 3 infected individuals at day 1, an average of 10 interpersonal interactions per day, 5% probability of infection following interactions with infectious individuals, 3% of symptomatic individuals self-isolate (with 2.5 interactions per day) on each day of illness, hospital capacity is 400 beds, and case fatality is doubled for cases above this limit who require hospitalisation.
Our six intervention scenarios looked like this:
- Scenario 1: Ramp up self-isolation from days 1 to 15, such that the proportion of newly symptomatic and/or diagnosed individuals who self-isolate on each successive day of illness increases from 3% to 33%.
- Scenario 2: As for Scenario 1 except that the proportion of individuals who self-isolate increases from 3% to 66%.
- Scenario 3: Scenario 1 plus ramp up of moderate social distancing from day 15, such that the daily number of interactions in the population overall is reduced from 10 to 5 over a further 15 days, where it stays for a further 45 days, before increasing back up to 10 (i.e. total of ramp-up plus maintenance period is 60 days).
- Scenario 4: Scenario 1 plus 30-day lockdown from day 30, such that the daily number of interactions in the population overall is immediately reduced from 10 to 2.5, then increases back up to 10 from day 60.
- Scenario 5: As for Scenario 4 except lockdown is for 60 days, lasting until day 90.
- Scenario 6: Scenario 5, with the addition of self-isolation with high compliance commencing at 90 days (66% of newly symptomatic and/or diagnosed individuals self-isolate on each successive day of illness).
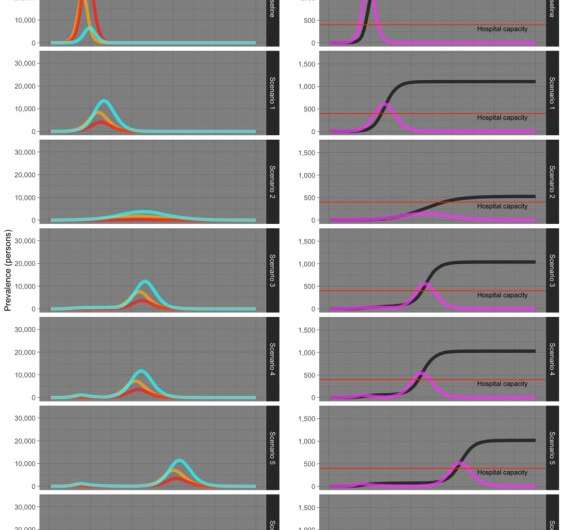
Under all of our intervention scenarios, the COVID-19 epidemic curve is substantially flattened AND shrunk, with far fewer cases and deaths overall. Under most scenarios, the number of cases requiring hospitalization briefly overwhelms assumed hospital capacity, but at different time points.

Scenario 1 demonstrates that moderate compliance with self-isolation substantially dampens the epidemic and reduces deaths by around one-third. Scenario 2, which perhaps resembles the extreme case finding and enforcement of self-isolation and quarantine enacted in South Korea and Singapore, results in almost complete suppression of the epidemic, with no second peak in cases, or "rebound."
Scenario 3, which combines ramp up of self-isolation and social distancing and is perhaps analogous to the Australian response to date, results in reduction in cases and deaths by around one-third. A rebound in cases that is much larger than the initial, suppressed, peak occurs at around day 90.
Among the "lockdown" scenarios, Scenarios 4 and 5 demonstrate a similar rebound in cases, which is delayed according to the duration of the lockdown. A small and very delayed rebound occurs in Scenario 6, which combines lockdown and subsequent high compliance with self-isolation.
Our findings are broadly consistent with those produced by modellers at Imperial College using scenarios for the United Kingdom and U.S..
What next?
Our work illustrates the complexity of predicting the potential impact of public health interventions on the course of the COVID-19 epidemic and it is important to note that our model has been developed very rapidly at a time when we don't have good data to inform many of our assumptions. However, encouragingly, our modeling strongly suggests that we can "shrink the curve" and reduce COVID-19 cases and deaths with strong public health action and without prolonging the nightmare of lockdown and social distancing. We shall continue to refine our model and it is freely available for others to use, test and further develop to ensure that policy actions are informed by the best possible evidence (we have described the model in detail on Tim's Website, and have made the code available on Github).


