November 3, 2021 feature
Monitoring blood flow velocity with a flexible Doppler ultrasound device
 Schematic of the Doppler ultrasonic device. The device continuously transmits ultrasound waves and receives echoes from a moving scatterer (such as red blood cells). (B) Schematics (left) and exploded view (right) of the device structure. ACF, Anisotropic Conductive Film. (C) Detection concept. Each received echo is Doppler-shifted relative to the frequency transmitted by the transducer, which is related to the velocity of the scatterer. A mixture of Doppler frequency shifts that changes from moment to moment and from place to place within the vessel lumen is produced by many moving scatterers in blood flow. After demodulation and power spectral density (PSD) analysis, the Doppler spectrum that contains the absolute frequency shift or velocity is obtained. (D) Optical image of the cross section of the semifinished device before top electrode bonding. The device with transducer arrays, bottom electrodes, and substrate was placed on a glass plate. (E) Optical image of the device when bent around a curved surface. Photo credit: Fengle Wang, Tsinghua University. Credit: Science Advances, 10.1126/sciadv.abi9283")
Researchers aim to implement a clinical strategy to monitor vascular conditions such as restenosis and thrombosis after vascular reconstruction procedures. Conventional ultrasound probes are rigid devices for patients with post-operatively fragile skin. In a new report now published on Science Advances, Fengle Wang and research team in engineering, mechanics and medicine in Beijing, China, introduced a flexible Doppler ultrasound device to continuously monitor the absolute velocity of blood flow in deeply embedded arteries using the Doppler effect. The skin conforming device was thin and light weight. Using the dual-beam Doppler (DBUD) method, Wang et al. obtained accurate measurements of the flow velocity. The wearable Doppler device can enhance the quality of care for patients after reconstruction surgery.
The cardiovascular system
Clinicians assess variations of the cardiovascular system by examining variations in blood flow in time and space. Blood flow in arteries can vary in a pulsatile manner due to intermittent heart pumping where the flow velocity near the blood vessel wall is lower than at the center of a vessel. Vessel characteristics including their dimensions and compliance have an impact on the hemodynamics occurring within them. Flow velocity parameters can also determine thrombus, artery stenosis, hardening occlusion and other diseases. Continuously monitoring the blood flow of patients is therefore necessary in clinical practice and healthcare. In present healthcare systems, ultrasound equipment including the handheld ultrasound device are incorporated to measure blood flow. In this work, Wang et al. presented a continuous-wave Doppler ultrasound device for real-time, continuous monitoring of absolute blood flow. The array design and dual-beam ultrasound Doppler method allowed them to obtain absolute velocity and eliminate the need for calibration. Wang et al. demonstrated the device on ultrasound phantoms and on human arteries to display its excellent capacity to monitor blood flow velocity.
 Schematic of oblique incidence of the ultrasound beam through the Ecoflex substrate and skin. The ultrasound beam will refract on the interface because of acoustic impedance mismatch. (B) Relationship between the intensity ratio of the transmitted wave to the incident wave and the inclination angle of the transducer θ. (C) Simulated beam pattern of a piezoelectric transducer with a 20° inclination angle. (D and E) Impulse response (A) and frequency response (B) of the transducer before and after being bent 500 times. (F) Comparison of the amount of pressure applied to the skin during measurements. The dark, dark gray, and light gray lines represent three measurements of variations in the pressure with time produced by the commercial probe. The red line represents the results of our Doppler device. Credit: Science Advances, 10.1126/sciadv.abi9283")
Ultrasonic measurements of blood flow velocity were based on the Doppler effect with piezoelectric transducers that transmit ultrasound waves with a frequency into the skin. When moving scatterers such as red blood cells produce an echo, the received frequency deviated from the transmitted frequency to form a Doppler shift. This usually depends on the speed of sound, flow velocity and the known Doppler angle between the axis of the ultrasound beam and the direction of flow looking towards the transducer. The Doppler signal of blood flow indicated a mixture of many single-frequency signals of scatterers with different velocities in the blood flow, with a corresponding amplitude, frequency and phase. The team used a continuous wave Doppler in the device where one transducer continuously transmitted an ultrasound beam, and an adjacent transducer received the scattered echoes from the blood. The device offered simple signal processing and easy functionality, compared to pulse-wave doppler devices. To design the flexible device, Wang et al. addressed a few key limitations by using an angled transducer array to form opaque ultrasound beams to determine relative motion between the ultrasound beam and scatterers. They then determined the Doppler angle, by using a dual-beam ultrasound Doppler method (known as DBUD method) to determine the inclination angle. The transducer showed excellent beam directivity. The team determined the pulse response and frequency response of the transducer and noted a stable central frequency approximating 5 MHz.
-
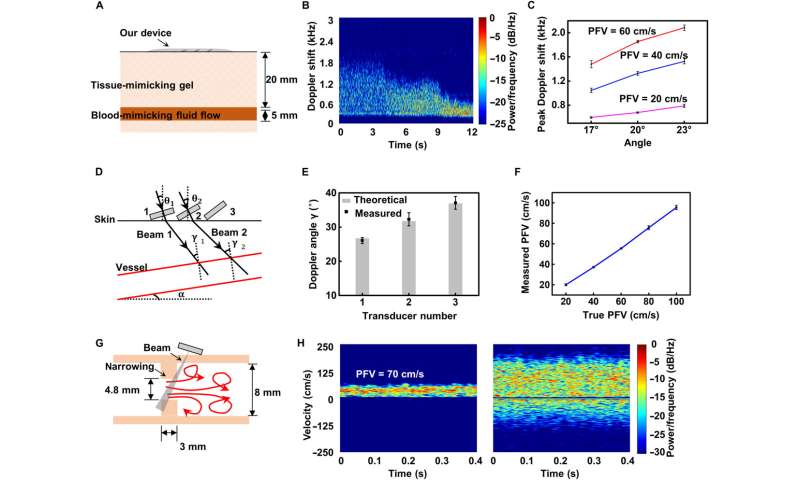
In vitro device validation. (A) Structure specification of ultrasound phantom. (B) Doppler spectrum of blood-mimicking flow with PFVs varying from 60 to 20 cm/s by using 17° transducers. The time is represented on the horizontal axis of the Doppler spectrum at the base of the display. The frequency bin is shown on the vertical axis of the spectrum, which can be converted into a velocity value using the Doppler equation. Both the forward and reverse Doppler signals are displayed simultaneously on the same spectrum, with flow toward the transducer displayed on the positive half-axis and flow away from the transducer displayed on the negative half-axis. The distribution of frequency bins within the sample volume is illustrated by the brightness of the spectral display. The brightness of a pixel is proportional to the number of scatterers causing that frequency shift at that specific point in time. (C) Measurements by 17°, 20°, and 23° transducers at three PFVs of 20, 40, and 60 cm/s. (D) Schematic of the DBUD method. (E) Calculations of the Doppler angle γ by using the pairwise results of the Doppler peak shifts produced by the 17° (1), 20° (2), and 23° (3) transducers. Error bars represent ±SD (N = 5). (F) Measured PFV versus true PFV curves. Error bars represent ±SD (N = 5). (G) Schematic of the flow through a constriction followed by a rapid expansion downstream, showing the regions of turbulence. (H) Spectra of flow in the normal segment of the tube (left) and flow around the narrowing site (right). The velocity increases as the blood flows through the narrowing site (from left to right) followed by an area of flow reversal beyond the narrowing. Credit: Science Advances, 10.1126/sciadv.abi9283 -
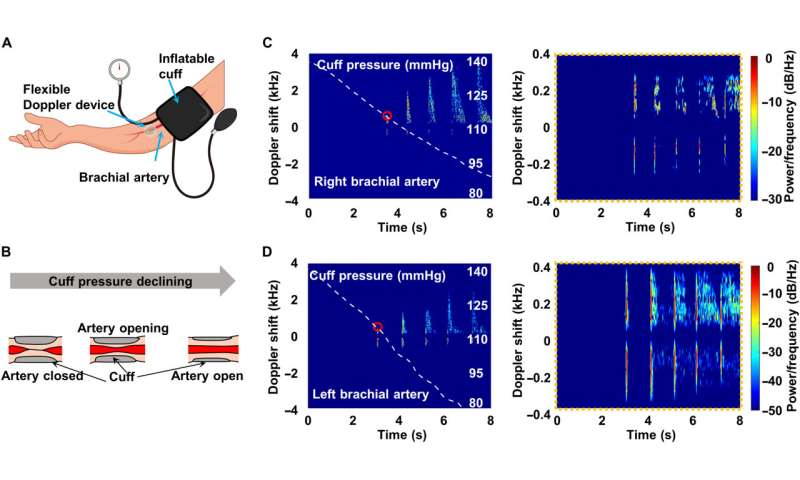
Monitoring of blood flow and artery wall motion in cuff experiments. (A) Measurement setup, with our device and an inflatable cuff wrapped around the upper arm. (B) Schematic of the measurement. The cuff is initially inflated above 140 mmHg to occlude arterial flow. Then, the artery reopens, and blood flow resumes at some point as the cuff pressure declines. (C and D) Doppler spectra and cuff pressure variations (white dashed line) of the right brachial artery (C) and left brachial artery (D). The graphs in the right panels of (B) and (C) show the motion of the artery wall. The small red circles represent the systolic arterial pressure. Credit: Science Advances, 10.1126/sciadv.abi9283
Characterizing the device and understanding the DBUD method
The team next tested the device on a standard ultrasound phantom designed to mimic tissue material and blood fluid that simulated the acoustic characteristics of real human tissues and fluid. Wang et al. measured the Doppler spectrum of the blood-mimicking flow under different velocities and adjusted the peak flow velocity accordingly. With increasing inclination angle and velocity, the peak frequency shift also increased. To accurately measure the blood flow velocity using the Doppler effect, the researchers had to know the angle between the direction of flow and the ultrasound beam. The angle between the direction of the vessel and the skin surface is, however, typically uncertain; therefore, to overcome this, Wang et al. used piezoelectric transducer arrays with different inclination angles to qualitatively measure the flow velocity. They derived the principle of this method as DBUD (dual-beam ultrasound Doppler method) and determined a unique solution of Doppler angles, flow velocity and the inclination angle of the vessel. The team then calculated the Doppler angle and measured the absolute velocity without calibration.
Simulated experiments
Atherosclerosis can cause artery narrowing (stenosis), which leads to increased resistance to blood flow and artery occlusion. Blood flow through arteries is generally laminar, but it can rapidly increase when encountering a stenosis to cause turbulence beyond the narrowing. By developing an in vitro narrowing simulator, Wang et al. simulated narrowing to capture blood flow characteristics under different conditions. The team next conducted spectrum analysis to obtain quantitative information for blood vessels. When compared with constant flow, blood flow was pulsatile and produced a jumble of Doppler frequency shifts. Wang et al. obtained an accurate measurement of the carotid blood flow velocity and compared it with the result of a commercial ultrasound machine. The carotid artery is associated with cerebral blood flow and has a typical spectrum of five feature points. Wang et al. validated the outcome relative to commercial ultrasound machines and displayed the measurements in the form of Doppler audio in the audible range as well. The device continuously represented changes in vascular resistance to prove its role in capturing the characteristics of blood flow.
 Typical carotid blood flow spectra during a cardiac cycle (left) and several cycles (right). Feature points are marked in the left image. Insets: An image showing the device mounted on the neck. (B) Spectrum of carotid blood flow from a commercial ultrasound machine. (C) Calculated key blood flow parameters compared with those obtained by the commercial instrument. Error bars represent ±SD (N = 5). (D) Doppler audio waveform of measured carotid blood flow. (E) Continuous measurement of radial artery blood flow after exercise. The flow waveform gradually transitions from a low-pulsatility monophasic pattern [low resistance (LR)] to a high-pulsatility pattern [high resistance (HR)]. All the spectra of (A) to (F) use the same color bar as in (A). (F) Measurements of peripheral arteries (bottom row) and validation (top row) by a commercial instrument. Columns (left to right): brachial artery, radial artery, and dorsalis pedis artery. The small red circles represent the PSV (solid line) and maximum reverse flow velocity (dotted line). The numbers 1, 2, and 3 represent the three phases of blood flow. Credit: Science Advances, 10.1126/sciadv.abi9283")
Outlook
In this way, Fengle Wang and colleagues developed a flexible, and lightweight Doppler ultrasound device to non-invasively monitor real-time blood flow velocity within human arteries. The device was simple without complex imaging components when compared to the clinical ultrasound machine. The team employed a technique to provide absolute velocities of all moving scatterers in the sample range, based on the dual-beam Doppler (DBUD) method. The researchers propose the use of the device to monitor blood flow velocity after vascular reconstruction procedures.
More information: Fengle Wang et al, Flexible Doppler ultrasound device for the monitoring of blood flow velocity, Science Advances (2021). DOI: 10.1126/sciadv.abi9283
Clementine M. Boutry et al, Biodegradable and flexible arterial-pulse sensor for the wireless monitoring of blood flow, Nature Biomedical Engineering (2019). DOI: 10.1038/s41551-018-0336-5
© 2021 Science X Network


