October 7, 2013 feature
Improving our image: Motion-tolerant BOLD fMRI improves signal-to-noise, connectivity analysis and statistical inference

(Medical Xpress)—Functional neuroimaging technologies – such as functional Magnetic Resonance Imaging (fMRI), Positron emission tomography (PET), multichannel electroencephalography (EEG), magnetoencephalography (MEG), Near Infrared Spectroscopic Imaging (NIRSI), and Single Photon Emission Computed Tomography (SPECT) – are used to measure brain activity and its relationship to specific brain areas. Of these, resting state fMRI (known as rs-fMRI) is employed to evaluate regional interactions that occur when a subject is not performing an explicit task. Since these interactions represent network communication between brain regions, their study is integral to further understanding human behavior, cognitive development and neuropsychiatric disease. More specifically, this resting brain activity is observed noninvasively using fMRI, which detects changes in blood flow in the brain as Blood Oxygen Level Dependent (BOLD) MRI signals.
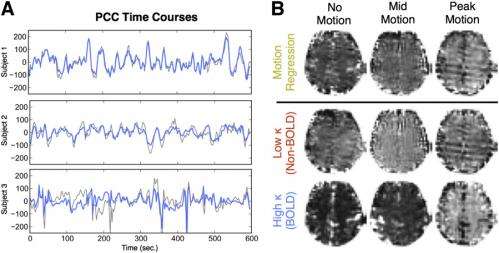
While powerful, so-called BOLD fMRI has two drawbacks: even 1 mm or less of head movement while scanning can impact connectivity estimates, and BOLD sensitivity can be reduced by high subject motion. (This limitation means that when comparing the rs-fMRI data of adult controls versus high-movement subjects such as neuropsychiatric patients or children, false positive functional connectivity findings can become very prevalent.) Recently, however, scientists at the National Institute of Mental Health, University of Cambridge and other locations devised an integrated strategy for data acquisition, denoising, and connectivity estimation by combining data acquisition with multiecho (ME) echo planar imaging and analysis with spatial independent component analysis (ICA), called ME-ICA, which distinguishes BOLD (neuronally related) and non-BOLD (artifactual) effects. The researchers found that when compared with traditional techniques, their proposed strategy results in a fourfold signal-to-noise ratio improvement, more specific functional connectivity analysis, and valid statistical inference and error control between groups with different levels of subject motion.
Lead researcher Prantik Kundu – who is supported by the NIH-Cambridge Scholars program, under the joint supervision of Dr. Peter Bandettini at NIH and Dr. Ed Bullmore at Cambridge University – discussed with Medical Xpress the research he and his colleagues conducted. "We're studying spontaneous brain activity, captured as BOLD MRI signals, for the purpose of inferring functional relationships between brain areas based on the correlation of their BOLD fMRI signal time courses," Kundu tells Medical Xpress. "Unfortunately, fMRI methods are susceptible to artifact signal from subject motion, magnetic field changes and other sources. That being said, the biggest problem is that functional BOLD signals and artifact signals occur in approximately equal proportions and may manifest with similar time courses and spatial localization patterns."
In essence, Kundu explains, an analysis of spontaneous BOLD fluctuations can't take advantage of a prior model for expected signals – and artifacts can manifest in virtually any form. As a result, separating functional BOLD signals from artifact signals is a fundamental challenge for all studies of functional brain connectivity. "This separation has been so challenging, in fact, that some recent studies have implied that this may be too difficult to do in a physically and statistically principled way, suggesting that potentially corrupt fMRI images be deleted completely."
In recognizing that BOLD signals and artifacts from fMRI were not totally distinct in their spatial or temporal properties, Kundu points out that the team's insight was to use a third domain of information that would completely distinguish BOLD and artifact signals. "This third domain was the NMR decay of BOLD signals from functional brain activity," Kundu says. "BOLD signals have a specific and robust signature called echo-time, or TE, dependence that artifacts do not." The key is that TE-dependence is observable in data acquired with an emerging MRI pulse sequence called multiecho fMRI – but not with standard fMRI sequences that do not acquire multiple NMR signal echoes. Kundu adds that using this third signal domain to disentangle BOLD and artifact has been attempted in a few prior studies using model-fitting approaches – but these approaches, while informative, have had limited applications.
"We realized that joining a powerful multivariate statistical decomposition called independent component analysis (ICA) with the analysis of TE-dependence could be an effective way to comprehensively separate all BOLD signals from all artifact signals," Kundu continues. "In essence, the dataset is broken up into statistically coherent components, with each then being analyzed to determine its BOLD and non-BOLD weighting." The final step is to denoise the data by removing non-BOLD ICA components.
Kundu points out that the new strategy is based on their previously-published technique combining data acquisition with multiecho planar imaging and analysis with spatial independent component analysis. "Our first paper demonstrated that 'statistically independent' components arising from ICA decomposition specifically captured signals representing actual physical processes of BOLD and artifact," he explains, adding that the level of physical specificity of ICA components was a new inference not previously established in the ICA literature.
The standard ICA implementations for fMRI, however, did not use TE-dependence analysis throughout the many processing steps required. "This meant lower sensitivity overall, so low amplitude signals – such as from the subcortex, which are important in studies of emotion – could be incompletely assessed. "We developed an implementation of ICA for ME fMRI that does use TE-dependence analysis throughout, resulting in a comprehensive analysis that fully decomposes fMRI datasets." Kundu emphasizes that this was a substantial improvement over the approach used in their earlier paper.

Another key factor was developing their independent components regression (ICR) estimator. "Besides separating functionally-related BOLD signals from non-BOLD artifacts, another fundamental problem for functional connectivity analysis based on inter-regional BOLD time series correlation is determining the statistical significance of correlation," Kundu says. "That means determining whether a particular correlation is arising by chance, an anatomical – that is, white matter – connection, or functional process involving multiple regions." In identifying a chance correlation, he adds, it has to be taken into consideration that spontaneous BOLD fluctuations are oscillatory and manifest smoothly over space – so identifying a significant correlation is analogous to finding synchronized waves in a turbulent ocean.
"We realized that ICA decomposition actually transformed spontaneous BOLD signals into a new basis of statistically independent coefficients on which statistically well-conditioned interregional correlation can be computed," Kundu recounts. By incorporating TE dependence analysis in prior analysis steps, processing sensitivity increased. As a result, statistically well-conditioned re-expression by ICA represented all BOLD signals in the data as 'independent' components.
"We then realized that the number of BOLD independent components was also the statistical degrees of freedom of the spontaneous BOLD signals – that is, their complexity or variability. This allowed statistical inference using well-understood classical statistical tests." By combining interregional correlation on the basis of independent coefficients, and then normalizing correlation values with BOLD degrees of freedom (DOF), they created the ICR functional connectivity estimator. "Lastly, we realized that greater artifact in fMRI data had the unforeseen effect of reducing BOLD DOF in fMRI datasets, since artifact processes from subject motion interfered with NMR relaxation and thus reduced BOLD sensitivity."
Practically, Kundu says, this meant that, after filtering conventional fMRI data, greater subject motion led to apparently greater BOLD correlation due to less BOLD variability from less sensitive acquisitions. "By having the BOLD DOF measurement from multiecho fMRI data, however, we were able to control for this variability when computing functional connectivity using ICR."
Kundu relates that the scientists addressed these challenges through two main insights. First, TE-dependence analysis is indeed a very versatile and robust basis of differentiating BOLD and non-BOLD signals. Second, ICA – particularly when used to decompose full datasets (which is not a trivial task) – is very powerful and can be leveraged in more ways than is currently appreciated in fMRI methodology.
"By combining TE-dependence analysis and ICA for denoising, we realized that virtually all artifacts can be removed from fMRI data without prior knowledge of what the artifact is supposed to look like in terms of spatial localization or time courses. Prior approaches of fMRI analysis and denoising, such as modeling the physical translations and rotations of head motion and then removing those models based on linear fitting, were far less effective than employing a statistical nonlinear decomposition like ICA, and using the physical signal property of TE-dependence to determine what is BOLD and what is not."
After combining these approaches for connectivity estimation with ICR, the researchers found that tests on statistical conditioning indicated that functional connectivity analysis became much more consistent in assessments across subjects. This suggested, Kundu says, a more sensitive and specific approach, based on spontaneous BOLD fluctuations, to determining functional brain relationships. "To determine specific gains after using ME-ICA, we tested denoised BOLD signals with various metrics of signal quality, and compared them to the same metrics computed from fMRI data from conventional acquisition and processing. After removing artifact signals using ME-ICA, signal-to-noise ratio calculations indicated a fourfold increase in signal stability due to the removal of artifactual signal variation." In addition, a related analysis, employing metrics previously used to argue that separating BOLD and non-BOLD signal is not feasible, showed that ME-ICA eliminated both linear and more complex non-linear manifestations of artifact processes. "The increase in signal stability is consistent with the prior knowledge that easily fifty percent of fMRI signal variance comes from artifact, and this value can be even greater in data that is acquired during high subject motion."
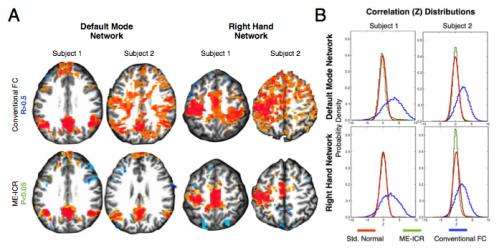
After the isolated spontaneous BOLD signals were re-expressed for functional connectivity analysis using ICR, Kundu continues, ICR functional connectivity maps for many brain regions were computed across multiple subjects. "When these maps were compared to corresponding connectivity maps computed with conventional functional connectivity analysis, an intra-class correlation statistical analysis showed that ICR substantially improved connectivity map consistency and specificity."
Kundu points out that the test for spurious connectivity findings (also called type I statistical error) was based on the premise that across a set of healthy volunteer data, there should be no average difference in connectivity between random sets of equally sized groups – including groups that are biased by subject motion. "Any increased likelihood of greater average correlation in high motion groups represents a bias in connectivity," Kundu explains. "Using permutation testing, we showed that ICR maintains a false positive rate that is expected and can be controlled for, whereas conventional connectivity estimation produces two to-five more false positive findings than expected – but the latter cannot be controlled for. This bias is likely due to unaccounted changes in BOLD fMRI sensitivity in the presence of high subject motion and other artifactual factors."
The researchers also found that their results were well-suited to studying patient populations with poorly characterized functional networks, as well as computing connectivity differences between healthy volunteers and patients. "Because ME-ICA and ICR connectivity estimation does not require spontaneous BOLD fluctuations to manifest in specific spatial or temporal patterns, any brain with functional BOLD fluctuations can be studied," Kundu tells Medical Xpress. "This includes normal controls, patients, and non-human subjects such as primates and rodents." Moreover, ME-ICA and ICR are more versatile than current methodologies that require BOLD signals to have specific spatial and temporal signals determined beforehand.
In terms of next steps, Kundu says that the team is currently applying their methodology across many fMRI studies. "We're especially interested in studies of development and aging, which may come with a wide variety of unexpected findings that can be definitely verified to be BOLD phenomena. Additionally," he concludes, "we plan to build atlases of well-conditioned functional connectivity – and in fact we've already open-sourced our software for public evaluation and use."
More information: Integrated strategy for improving functional connectivity mapping using multiecho fMRI, PNAS Published online before print September 13, 2013, doi:10.1073/pnas.1301725110
© 2013 Medical Xpress. All rights reserved.


