June 28, 2022 feature
A reference tissue atlas for the human kidney
. DOI: 10.1126/sciadv.abn4965")
A team of researchers including Jens Hansen, Rachel Sealfon, Rajastree Menon, and colleagues of the Kidney Precision Medicine Project, built on an existing specific human kidney tissue atlas relevant to health care at single-cell resolution. They advanced the atlas by integrating a reference map of cells, pathways and genes to the existing product. These additions involved unaffected areas of nephrectomy tissues and undiseased human biopsies. The team targeted single-cell nucleus transcriptomics including sub-segmental laser microdissection transcriptomics and proteomics to identify these genes, pathways and cells. The outcomes described the cellular-level functional organization of the kidney relative to its physiological function and then linked cell subtypes to genes, proteins, metabolites and pathways. The messenger RNA levels along the nephron agreed well with the sub-segmental physiological activity to provide a reference atlas as a framework to classify kidney disease with multiple molecular mechanisms underlying convergent clinical phenotypes.
A reference human kidney atlas
The kidney maintains diverse cell populations and is critical to facilitate physiological homeostasis by regulating fluid and electrolyte balance, osmolarity and pH. The nephron is the basic unit of organization in the kidney and is embedded in the interstitium, which contains between 210,000 and 2.7 million nephrons. Nephrons and the interstitium maintain multiple cell types to form blood vessels and capillaries, including endothelial cells and vascular smooth muscle cells, as well as a range of immune cells. Researchers have maintained sustained efforts to develop structure-function endo-phenotype relationships within the kidney tissue to understand the physiology and pathophysiology of the organ. In this work, Hansen et al studied 56 adult human subjects, and analyzed 80,289 single cells. The scientists constructed maps of diverse cell types in the kidney as well as the molecular entities and functional pathways in these cell types to form a unique reference human kidney atlas. The data of the study can be downloaded as an interactive cellular atlas to provide a starting point to understand disease states in the kidney and project a new functional context to drive new molecular classifications of kidney disease.
 data integration and harmonization procedures. The “subway map” representation of the experimental and analytical protocols used within KPMP is shown in operational flow from kidney biopsy to the integrated multimodal data represented in this manuscript. The kidney biopsy, which is processed through three different tissue processing methods, is shared among tissue interrogation sites (TISs) that generate the data. Four key modalities of molecular data are generated: transcriptomic (red), proteomic (blue), imaging (yellow), and metabolomic (green). Biopsy cores 2 and 3 are used for the molecular analysis; biopsy core 1 (not depicted) is used for histological analysis. Credit: Science Advances (2022). DOI: 10.1126/sciadv.abn4965")
The Kidney Precision Medicine Project (KPMP) Consortium
To build the reference atlas, the scientists first conducted a variety of omics arrays and low-throughput imaging experiments at different sites. The specimens used in the work did not show any structural signs of disease, and were obtained from nephrectomies and biopsies of donors and transplant recipients. Based on the shared tissue samples, Hansen et al conducted four transcriptomic, two proteomic, two imaging-based, and one spatial metabolomics tissue interrogation assays. The researchers then integrated multiple transcriptomic interrogation methods to show agreement and technical synergy between the assays. The outcomes confirmed all known major kidney tissue cell types of the nephron and multiple immune cells. The team conducted additional independent methods to improve the atlas framework.
 Scheme showing the major nephron segments as identified in our datasets. Sc and sn datasets were either analyzed separately or combined. Uniform manifold approximation and projection documents the results of the combined analysis. Cell subtype counts were obtained from the separated analyses (fig. S4, A and B). The corresponding LMD segments shown include the markers used to identify each subsegment: phalloidin, fluorescein isothiocyanate–labeled phalloidin for dissection of glomeruli and other structures; LRP2, megalin with Alexa Fluor 568 secondary (red); UMOD, directly conjugated Alexa Fluor 546 antibody to uromodulin (red); fluorescein-labeled PNA, peanut agglutinin labels collecting ducts (green); 4′,6-Diamidino-2-phenylindole was included for nuclei (blue). (B) We used Pearson correlation analysis of gene expression data to identify the closed subsegment in the LMD RNAseq data for each cell or nucleus in the combined transcriptomic analysis. Numbers document the number of cells/nuclei of each cluster mapped to each segment. (C) We calculated log2 fold changes between podocyte (or glomerulus) and PT cells (or tubulointerstitium) for each subject based on each assay. Pairwise correlation coefficients between all log2 fold changes were determined and used for hierarchical clustering. The variation in the axial ranges represents the divergences in the dynamic range of different assays as the axes are non-normalized. (D) Log2 fold changes obtained by the same assay were averaged across all subjects, followed by averaging of the results across all four transcriptomics and two proteomics assays. Positive or negative log2 fold changes indicate podocyte/glomerular or PT/tubulointerstitial expression. (E) Pairwise correlations between the sc/sn RNAseq and proteomic datasets document highest concordance between both proteomic and single-cell assays. Positive and negative log2 fold changes indicate podocyte/glomerular and PT/tubulointerstitial expression, respectively. Credit: Science Advances (2022). DOI: 10.1126/sciadv.abn4965")
Combining proteomic and transcriptomic assays
Hansen et al performed subsegment-specific protein expression profiles via two different proteomic assays to produce biologically complementary descriptions in the study. The assays identified protein expression in the glomerulus and tubulointerstitium, as well as the proximal tubule. They focused on podocyte/glomerular and proximal tubule cells during the work and sub-segmented into four transcriptomic datasets. Based on clustering datasets, they readily identified groups of genes or proteins associated with the appropriate anatomical regions. The outcomes highlighted the significance of relative expression levels of genes or proteins to indicate the corresponding anatomic region of the kidney. The combination of multiple datasets increased the accuracy of the results. The team further integrated imaging assays to the experiments to arrange different cell subtypes along the nephron and interstitium to document the order in which the regions encountered the glomerular filtrate.
Molecular basis of physiological functions at cellular resolution
After establishing the consistency across transcriptomics, proteomics and imaging datasets, Hansen et al integrated data to identify cell type-specific functional pathways and network modules. They used individual analyses of single-cell and single-nucleus RNA sequencing datasets by identifying the pathways referred to from the expressed genes. The work facilitated the identification of functional capabilities of different cell types from the kidney. Further outcomes established the accuracy with which they assigned pathways and physiological functions to different cell types. The team subjected the top 300 significant gene and protein markers of each cell type or subtype to dynamic enrichment analysis through molecular biology of the cell ontology analyses. They obtained fewer than 300 significant markers and consequently used them for downstream analyses and mapped their predicted pathways to create a detailed map of pathway activities in all major cell types in the kidney. The outcomes identified many well-known cellular activities for a range of kidney cell types.
-
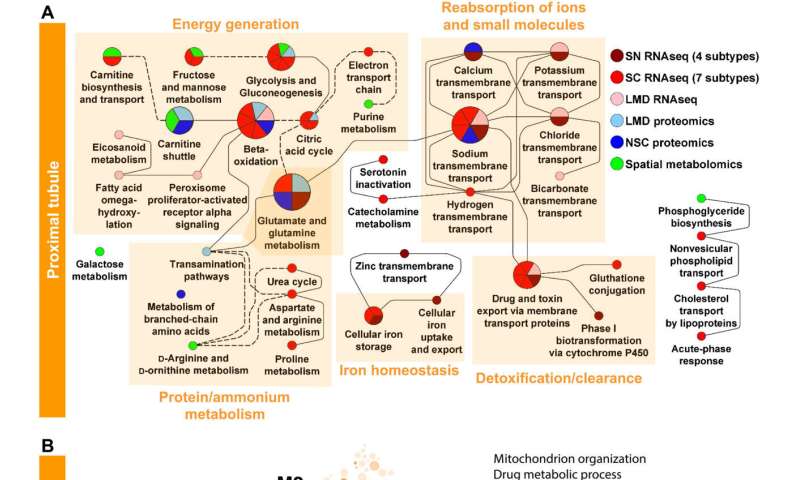
Enrichment analysis of markers for PT and glomerular cells and segments predicts well-known cell functions. (A) Marker genes and proteins of each PT cell subtype or subsegment were subjected to dynamic enrichment analysis using the MBCO. SCPs that were among the top seven predictions were connected by dashed lines, if their interaction was part of the top 25% inferred MBCO SCP interactions, and by dotted lines, if their functional relationship was curated from the literature. Figure S8 shows additional predicted SCPs involved in cell adhesion and translation. Metabolites associated with nonglomerular compartments were subjected to MetaboAnalyst enrichment analysis (fig. S6). Any pathway among the top eight predicted pathways that was predicted on the basis of metabolites specifically for that pathway was mapped to MBCO SCPs, if possible, and integrated into the PT SCP network. MBCO SCPs carnitine shuttle and carnitine biosynthesis and transport were added to the predicted MetaboAnalyst pathways since four and two involved metabolites were among the nonglomerular metabolites (see Methods for details). (B) HumanBase analysis of PT marker genes and proteins. Credit: Science Advances (2022). DOI: 10.1126/sciadv.abn4965 -
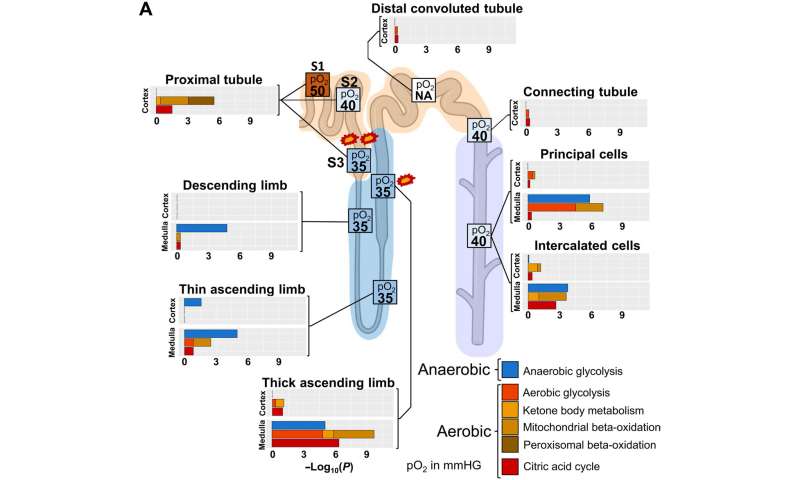
Aerobic and anaerobic energy generation profiles and oxygen supply accurately highlights sites of hypoxia-induced injury. To compare energy generation profiles with experimentally determined oxygen supply in the different nephron regions, we generated an ontology that allows the separation of aerobic and anaerobic pathways involved in energy generation. Enrichment analysis of cell type, subtype, and subsegment marker genes with this ontology predicts high dependency of PT cells on aerobic energy generation, suggesting S3 as a primary injury site during hypoxia (marked by two explosions) because of its low oxygen supply under basal conditions. Enrichment results predict a high aerobic energy generation activity for the mTAL that can be compensated by anaerobic energy generation. In combination with the already low oxygen saturation in that segment under normal conditions, our results suggest that mTAL is the second, although less likely, injury site during hypoxia (marked by one explosion). Enrichment results are combined. Numbers in boxes indicate pO2 in mmHg. NA, not available. Credit: Science Advances (2022). DOI: 10.1126/sciadv.abn4965
Identifying sites vulnerable to kidney injury
The scientists additionally studied the energy generation pathways in different cells along the renal tubule of the nephron by generating a focused ontology of metabolic pathways. They mapped the expression patterns of different paths involved in aerobic and anaerobic energy production to varying levels of oxygen availability in different parts of the nephron. The comparison allowed them to identify regions with higher susceptibility towards hypoxia-induced kidney injury. Molecular profiles of metabolic pathways in the atlas generally provide a fundamental outlook to understand kidney injury due to hypoxia in a clinical setting. The team conducted studies to determine the percentage of a filtered ion or small molecule reabsorbed in a specific segment of the nephron or excreted in the ureter. Since some nephron segments contain multiple cell types with diverse reabsorption mechanisms, they focused on cell type-specific transport mechanisms. The cell atlas therefore provided a detailed picture of sodium reabsorption in agreement with experimental reabsorption profiles for the first time.
 Estimated transcellular sodium reabsorption before and after removal of estimated paracellular sodium reabsorption from experimentally determined total sodium reabsorption profiles. (B) Using our and two other sn RNAseq datasets, we calculated the sum of all mRNA counts that mapped to genes involved in sodium lumen-to-blood (L2B) and blood-to-lumen (B2L) transport for each segment of the renal tubule. Net reabsorption capacities for sodium (colored bars) were determined by subtracting both sums and compared to experimentally determined transcellular sodium reabsorption (gray bars). (C) L2B and B2L cell type–specific transport mechanisms for sodium are visualized above and below the abscissa, respectively. Error bars document SEs. Parent-child relationships are documented in the legend, where children SCPs are written below their parent SCPs and shifted to the right. To prevent double counting, we removed any mRNA levels from each parent SCP that are already visualized as part of its child SCPs. Parent SCPs missing in the diagram were added to the legend next to an uncolored box for a proper documentation of the SCP hierarchy. In case of multiple parent SCPs, we only show one parent. Stacked bar diagram colors are in the same or reverse order as in the legend for L2B and B2L, respectively. Credit: Science Advances (2022). DOI: 10.1126/sciadv.abn4965")
Outlook: Clinical setting
In this way, Jens Hansen, Rachel Sealfon, Rajastree Menon and colleagues integrated multiple types of omics data to describe multiple subcellular processes and pathways at single-cell resolution. The outcomes highlighted the possibility of attaining a convergent clinical phenotype from diverse molecular changes of energy metabolism. These changes can be mapped in individual patients for better classification during disease.
More information: Jens Hansen et al, A reference tissue atlas for the human kidney, Science Advances (2022). DOI: 10.1126/sciadv.abn4965
Casey S Greene et al, Understanding multicellular function and disease with human tissue-specific networks, Nature Genetics (2015). DOI: 10.1038/ng.3259
© 2022 Science X Network


