September 4, 2023 feature
This article has been reviewed according to Science X's editorial process and policies. Editors have highlighted the following attributes while ensuring the content's credibility:
fact-checked
peer-reviewed publication
trusted source
proofread
Modeling the potential of kidney disease with an integrated organoid omics map

Kidney organoids provide a promising platform in vitro to model the mechanisms of kidney disease, however, they are limited by an existing lack of knowledge of their inherent functional protein expression. In a new report in Nature Communications, Martiz Lassé and a team of scientists in medicine and kidney health, in Denmark, Germany, and the U.S., defined the organoid proteome and their transcriptome trajectories during culture, and upon exposure to the tumor necrosis factor alpha (TNFα); a cytokine stressor.
While older organoids increasingly deposited an extracellular matrix and expressed decreased glomerular proteins, the team focused on highly aggregated expressions of TNFα associated protein expression in human tubular and organoid kidney cell populations to emphasize the scope of the models to advance the development of relevant biomarkers. The results provide crucial evidence of the functional relevance of the kidney organoid model to recreate human kidney disease in the lab.
The organoid model system
Organoids form an integral in vitro model system to explore disease development. Kidney organoids have modeled kidney cancer, glomerular diseases, and polycystic kidney disease. These platforms also offer a promising screening tool for therapeutics, to model viral infection and organ cryopreservation in combination with organ-on-a-chip microfluidics.
The concept can improve the understanding of genetic kidney diseases, interrogate kidney development and molecular mechanisms underlying pathologies. Kidney organoids can be generated from human pluripotent stem cells to recapitulate the elements of pathology that are lacking in two-dimensional tissue culture models and in animal models.

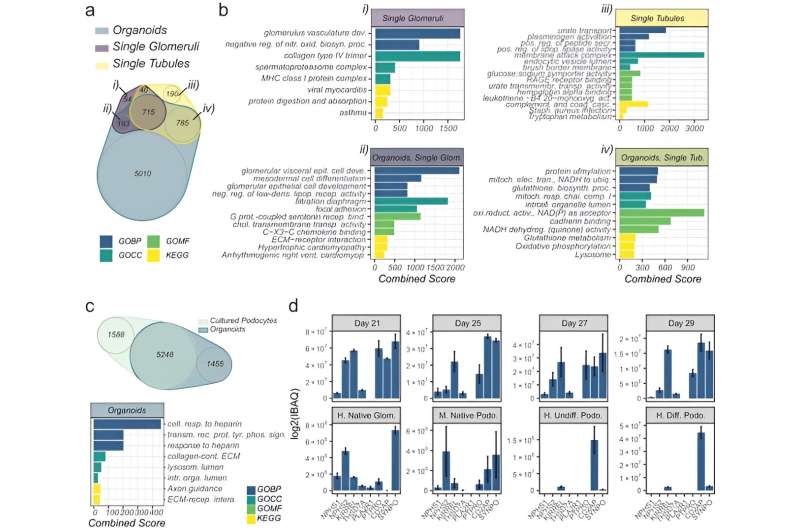
During the experiments, Lassé and colleagues at first described the evolution of the organoid proteome and transcriptome as a function of cell culture duration, to identify organoid cell types with changing protein expression. The team compared the expression of podocyte-specific proteins in organoids with the expression of native glomeruli and cultured podocyte cells.
The team analyzed the reaction of organoids to TNFα to provide disease-relevant biomarkers for precision diagnostics. Kidney organoid characterization allowed the platform's expansion for drug discovery, while assessing cellular biology underlying kidney disease to discover potential therapies. The outcomes provide a rich resource to the research community to promote kidney disease modeling, biomarker discovery, and therapeutic screening.
The duration of cell culture and the changing kidney organoid protein expression levels
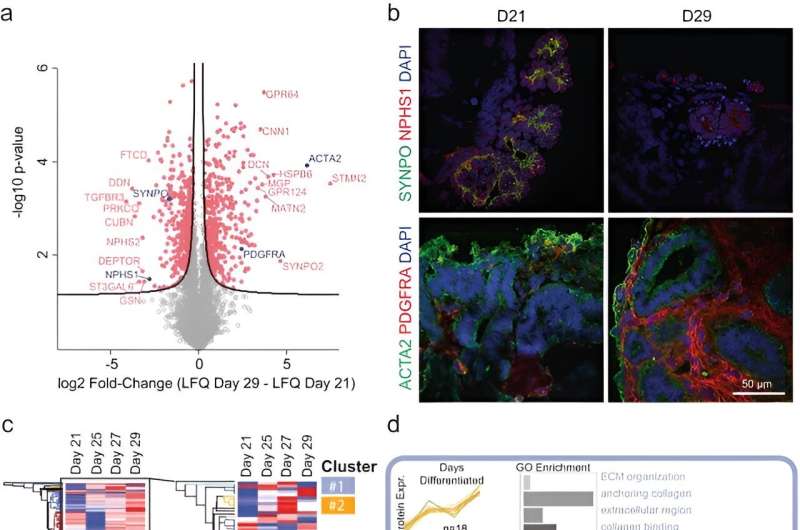
After three weeks of kidney organoid culture, Lassé and colleagues performed proteomic and transcriptional profiling. The scientists identified and quantified 5,403 proteins using principal component analysis, the results highlighted key podocyte markers/indicators of glomerular differentiation such as nephrin and synaptopodin to decrease with time, to highlight a loss of podocytes or cell populations with time.
They observed the increased expression of structural proteins such as smooth muscle actin and key regulatory differentiation proteins platelet-derived growth factor receptor alpha, to highlight an increased production of the extracellular matrix. The scientists validated these observations with immunofluorescence. They similarly noted higher expression of collagen type I alpha chain and fibronectin type 1 to confirm the patterns of increased extracellular matrix protein production with increased duration of cell culture.

The experiments
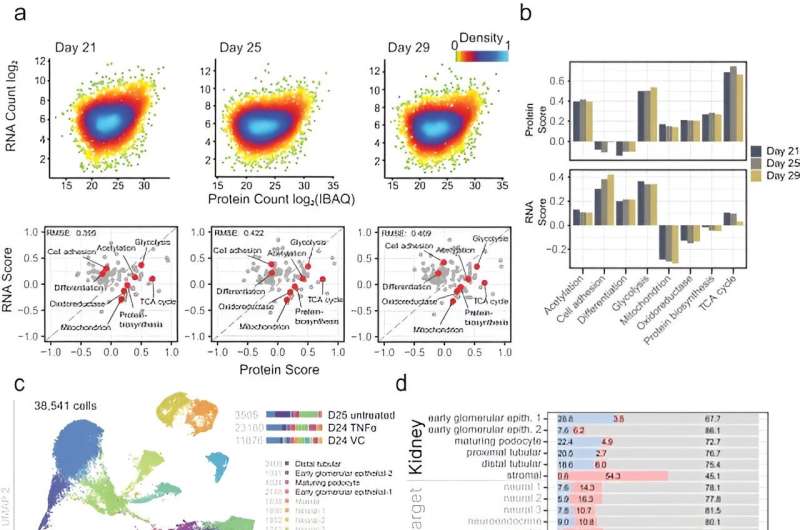
The scientists explored organoid proteome-transcriptome integration to uncover the cellular origins of proteins. The results suggested the largest proteome changes to occur in the stromal cell population, while the early glomeruli epithelial cells and maturing podocytes were less represented with longer culture duration, in agreement with the decreased cell-specific protein expression analysis too. The scientists compared the organoid proteome organization with mature human kidney tissue, which showed similarities with native human kidneys to indicate how such kidney organoids faithfully represented most key proteins in native kidneys.
The role of TNFα in organoid culture
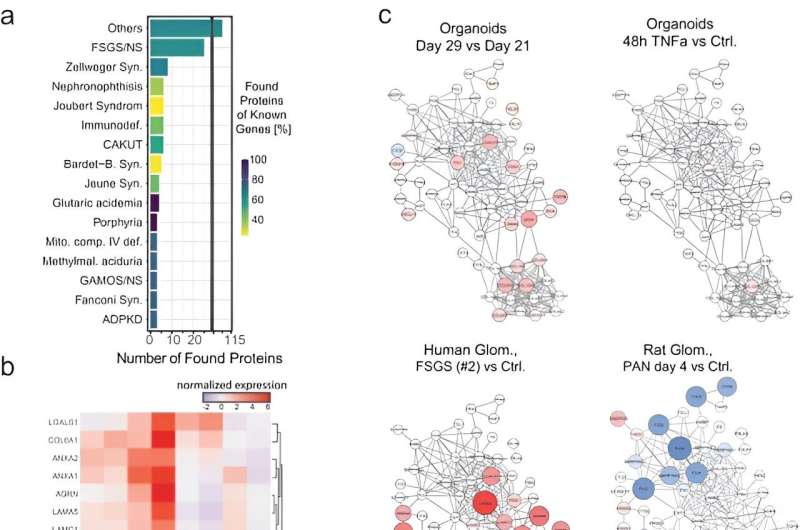
The team showed the response of organoids to TNFα by monitoring the expression of proinflammatory proteins. Notably, TNFα treated kidney organoids expressed key transcripts, including chemokine ligand 2, chemoattractant protein 1, and the tissue inhibitor of metalloproteinases. Lassé and colleagues reproduced TNFα induced gene expression to show a complex biological response of treated organoids, compared to the human podocyte model. The team demonstrated proteome alterations in TNFα induced organoids and revealed kidney cell-specific pathological mechanisms.
The TNF-dependent proteins also showed higher expression on a genetic level in various diseased kidney tissue, when compared to living donor tissue. While at the cellular level, the organoid TNF signature focused on gene activity, the comparative tissue TNF signature was more complex. Using literature-based networks, the scientists explored the unified interplay of the networks to identify sub-groups of individuals in disease cohorts with diverse pathomechanisms benefiting from a variety of targeted therapies.

Outlook
In this way, Martiz Lassé and colleagues showed how kidney organoids generated from human pluripotent stem cells have significant scope to advance the understanding of kidney development and disease. To successfully implement this concept as a model system, the scientists had to understand the complex structures and their relevance to human kidney disease. The experimental setup additionally provided insights to the pathobiology of TNFα associated kidney disease.
The study outcomes support the use of organoids to model complex human kidney diseases. By integrating the omics data derived from organoid disease models and other preclinical models, the team can drive better kidney outcomes for patients. The organoids can also capture critical elements of complex and heterogenous responses of the human kidney disease spectrum.
The omics map highlighted the capacity to trigger inflammation and fibrosis in organoids, even in the absence of immune cells to open the door to model more complex diseases with capacity to personalize disease modeling as well as therapeutic screening.
More information: Moritz Lassé et al, An integrated organoid omics map extends modeling potential of kidney disease, Nature Communications (2023). DOI: 10.1038/s41467-023-39740-7
The Organoid Cell Atlas, Nature Biotechnology (2020). DOI: 10.1038/s41587-020-00762-x.
© 2023 Science X Network


